> ## Documentation Index
> Fetch the complete documentation index at: https://basedash.com/docs/llms.txt
> Use this file to discover all available pages before exploring further.
# Dashboards
> Create and manage dashboards in Basedash
Basedash dashboards help you organize and share your data visualizations in one place. Create interactive dashboards that update in real-time and share them with your team.
For a product overview, see Basedash [dashboards](https://www.basedash.com/features/dashboards) or the guide to choosing [dashboard software](https://www.basedash.com/blog/dashboard-software-the-complete-guide-for-modern-teams-in-2026).
## Creating a new dashboard
1. Click "+ Dashboard" from your Basedash workspace
2. Give your dashboard a name
3. Start creating charts using AI
You can also describe a full dashboard in natural language. Basedash can generate the initial charts, queries, and layout from your prompt, then you can refine the dashboard with follow-up prompts or edit individual charts manually.
## Managing your dashboard
### Layout and organization
* Resize and arrange charts by dragging
* Use tabs to separate related dashboard views
* Organize dashboards into folders
* Favorite important dashboards for quick access
* Group related metrics together
* Add markdown text blocks for context
* Create sections with headers
### AI iteration
You can ask Basedash to add charts, update existing charts, change the layout, or refine the dashboard after it has been created. This is useful when you want to start from a broad dashboard prompt and then narrow the result into the exact operating view your team needs.
### Filters
* Add dashboard-wide filters
* Create date range selectors
* Filter by specific dimensions
* Apply filters to multiple charts
### Auto-refresh
By default, dashboards refresh every 15 minutes to keep your data up-to-date. You can change the refresh interval to fit your needs.
## Sharing and collaboration
You can share the dashboards you create with your team members in Basedash, or with the public. You have full control over who can view and edit the dashboard.
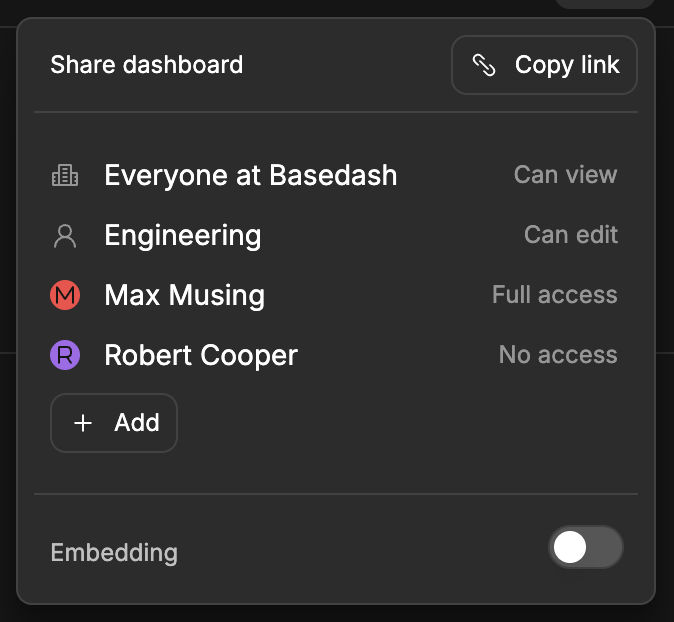 ### Permission levels
Here are the different access levels you can assign on a dashboard:
* Full access: Ability to do anything on a dashboard, including changing access levels.
* Can edit: Ability to edit dashboard properties or charts on a dashboard. You cannot change access levels.
* Can view: You can only view charts on a dashboard.
* No access: Cannot view a dashboard.
The dashboard creator always has full access. By default, everyone in your organization has full access to new dashboards, but admins can change this behavior — see [default dashboard access](#default-dashboard-access) below.
### Access model
Sharing can be configured in the share menu. You can control access for everyone in the organization, or for specific groups or members. When a user matches multiple grants, Basedash applies the most specific grant first.
Admins can create groups and manage group members from **Settings → Groups**.
### Default dashboard access
Admins can configure the default permissions that are automatically applied when any member creates a new dashboard from **Settings → Dashboards → Default access**.
### Permission levels
Here are the different access levels you can assign on a dashboard:
* Full access: Ability to do anything on a dashboard, including changing access levels.
* Can edit: Ability to edit dashboard properties or charts on a dashboard. You cannot change access levels.
* Can view: You can only view charts on a dashboard.
* No access: Cannot view a dashboard.
The dashboard creator always has full access. By default, everyone in your organization has full access to new dashboards, but admins can change this behavior — see [default dashboard access](#default-dashboard-access) below.
### Access model
Sharing can be configured in the share menu. You can control access for everyone in the organization, or for specific groups or members. When a user matches multiple grants, Basedash applies the most specific grant first.
Admins can create groups and manage group members from **Settings → Groups**.
### Default dashboard access
Admins can configure the default permissions that are automatically applied when any member creates a new dashboard from **Settings → Dashboards → Default access**.
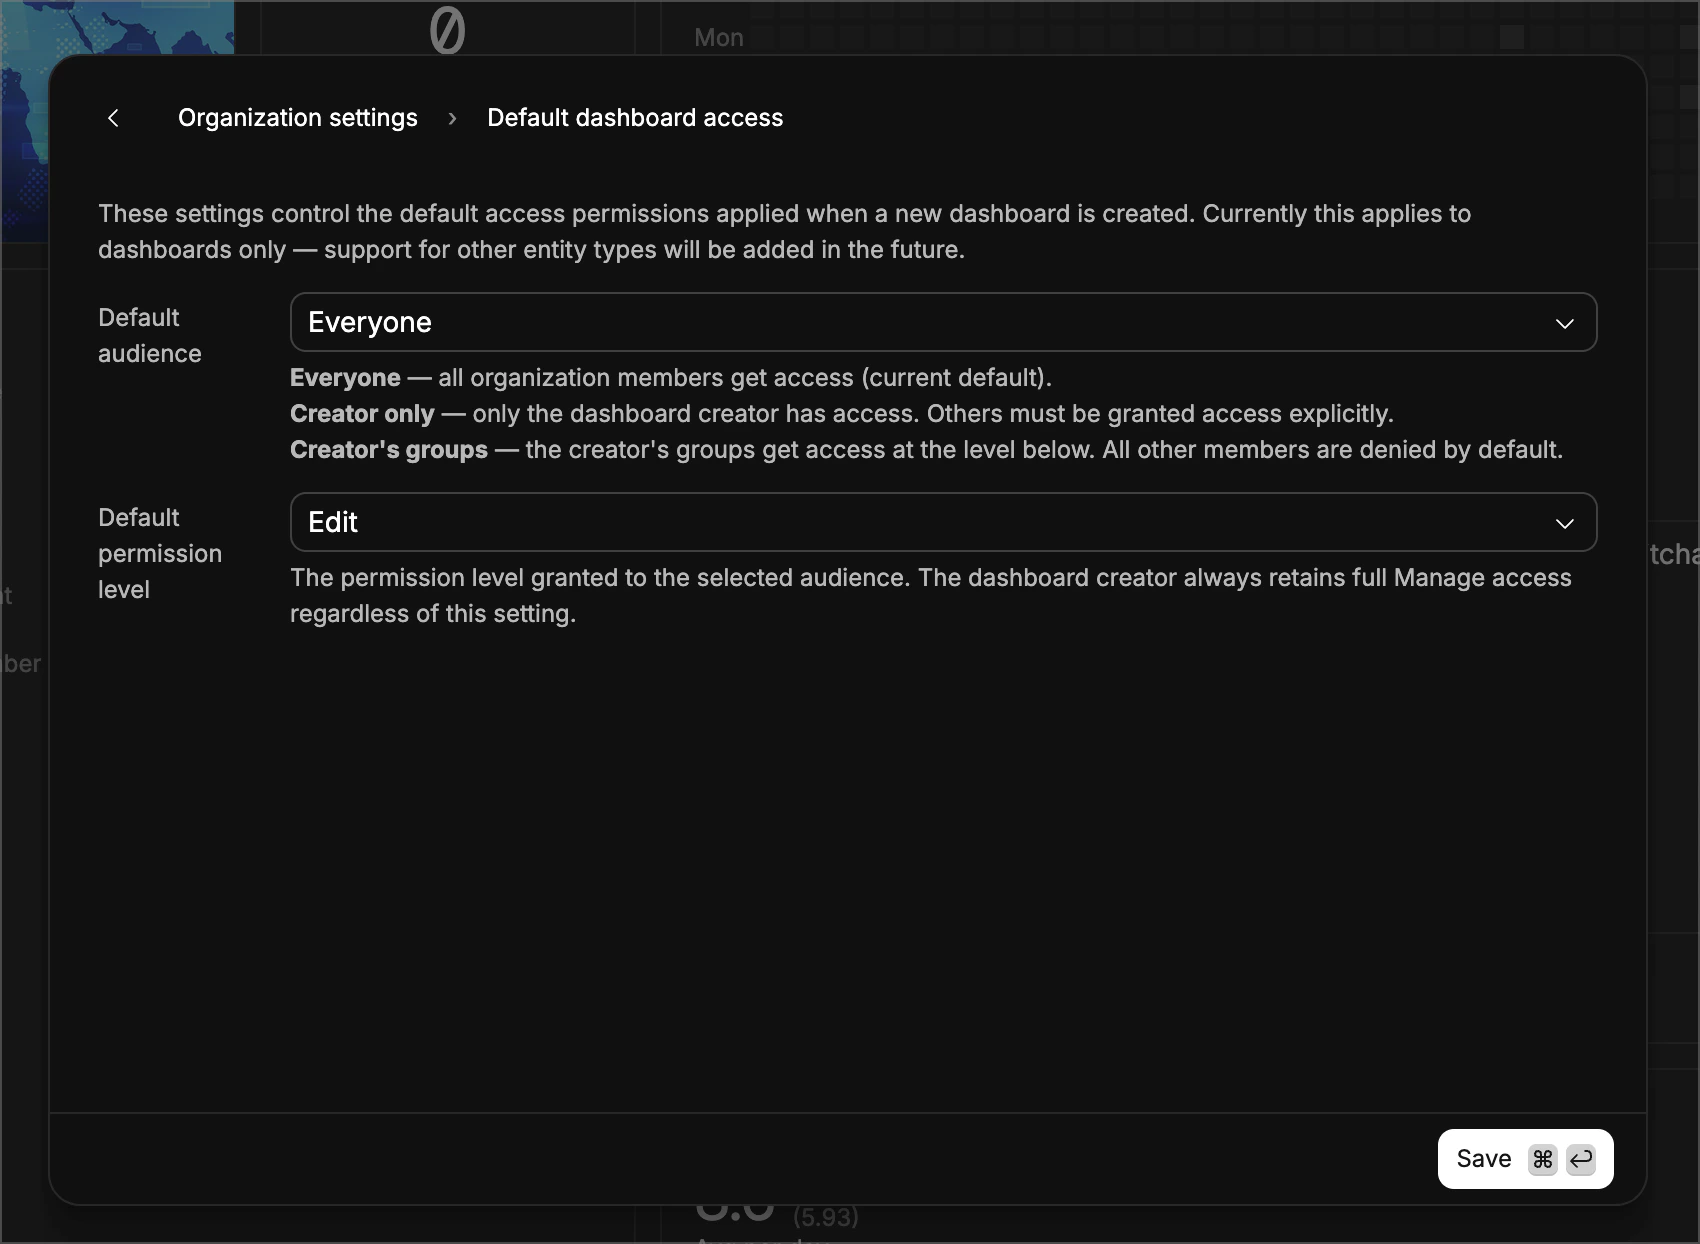 There are two settings:
**Default audience** — who gets access to new dashboards:
* **Everyone** — all organization members get access at the chosen permission level. This is the default, and matches the legacy behavior.
* **Creator only** — only the dashboard creator has access. All other members are denied by default and must be granted access explicitly. Permission level is always Full access.
* **Creator's groups** — members of the creator's groups get access at the chosen permission level. All other members are denied by default.
**Default permission level** — the level of access granted to the audience above:
* **Full access** — full access including changing permissions
* **Can edit** — can edit dashboard properties and charts, but cannot change permissions
* **Can view** — can only view the dashboard
The dashboard creator always retains Full access, regardless of these
settings.
Existing organizations default to Everyone + Full access, which is identical
to the previous behavior. No existing dashboards are affected — these settings
only apply to newly created dashboards.
### Public dashboards
You can share dashboards outside of Basedash by enabling embedding in the dashboard share menu. This creates a public link at `/shared/{id}` that you can share with anyone to view the dashboard. The public link does not require a Basedash account to view and only allows viewing, not editing.
You can control the color theme of the public dashboard, and enterprise users can optionally hide Basedash branding.
### Embedding dashboards
You can embed dashboards in your own website or app by using the public URL. This will allow you to share the dashboard with your audience, wherever they are.
For customer-facing use cases, see Basedash [embedding](https://www.basedash.com/features/embedding).
You can enable embedding in the dashboard share menu. This will create a public link that you can share with anyone to view the dashboard. The public link does not require a Basedash account to view and only allows viewing, not editing.
There are two settings:
**Default audience** — who gets access to new dashboards:
* **Everyone** — all organization members get access at the chosen permission level. This is the default, and matches the legacy behavior.
* **Creator only** — only the dashboard creator has access. All other members are denied by default and must be granted access explicitly. Permission level is always Full access.
* **Creator's groups** — members of the creator's groups get access at the chosen permission level. All other members are denied by default.
**Default permission level** — the level of access granted to the audience above:
* **Full access** — full access including changing permissions
* **Can edit** — can edit dashboard properties and charts, but cannot change permissions
* **Can view** — can only view the dashboard
The dashboard creator always retains Full access, regardless of these
settings.
Existing organizations default to Everyone + Full access, which is identical
to the previous behavior. No existing dashboards are affected — these settings
only apply to newly created dashboards.
### Public dashboards
You can share dashboards outside of Basedash by enabling embedding in the dashboard share menu. This creates a public link at `/shared/{id}` that you can share with anyone to view the dashboard. The public link does not require a Basedash account to view and only allows viewing, not editing.
You can control the color theme of the public dashboard, and enterprise users can optionally hide Basedash branding.
### Embedding dashboards
You can embed dashboards in your own website or app by using the public URL. This will allow you to share the dashboard with your audience, wherever they are.
For customer-facing use cases, see Basedash [embedding](https://www.basedash.com/features/embedding).
You can enable embedding in the dashboard share menu. This will create a public link that you can share with anyone to view the dashboard. The public link does not require a Basedash account to view and only allows viewing, not editing.
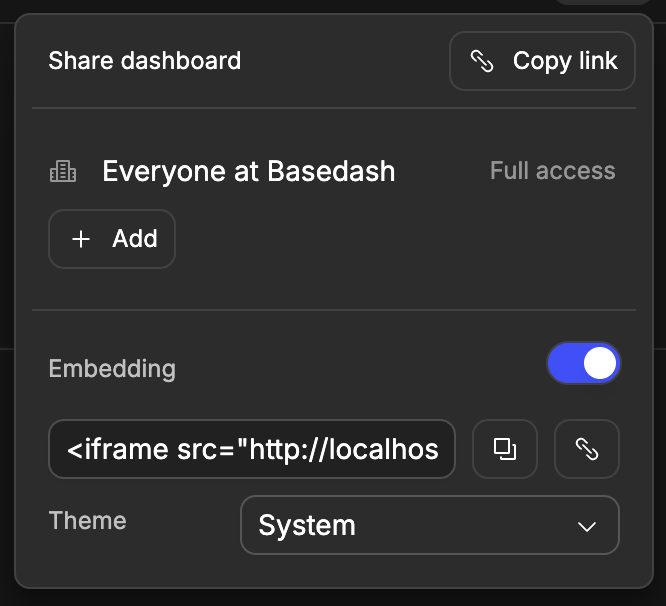 We also support controlling filter values when embedding dashboards. This allows you to share a dashboard with your audience and control the data shown for each user. See the [secure filtering guide](/features/embedding#secure-filtering) for setup details.
## Best practices
We have a full guide on tracking [startup metrics](https://www.basedash.com/startup-metrics/introduction).
1. **Dashboard organization**
* Start with high-level metrics
* Group related charts together
* Use clear section headers
* Add context with text blocks
2. **Performance**
* Limit charts per dashboard
* Use appropriate refresh rates
* Consider query complexity
3. **Collaboration**
* Add dashboard descriptions
* Document data sources
* Share access appropriately
* Keep stakeholders updated
We also support controlling filter values when embedding dashboards. This allows you to share a dashboard with your audience and control the data shown for each user. See the [secure filtering guide](/features/embedding#secure-filtering) for setup details.
## Best practices
We have a full guide on tracking [startup metrics](https://www.basedash.com/startup-metrics/introduction).
1. **Dashboard organization**
* Start with high-level metrics
* Group related charts together
* Use clear section headers
* Add context with text blocks
2. **Performance**
* Limit charts per dashboard
* Use appropriate refresh rates
* Consider query complexity
3. **Collaboration**
* Add dashboard descriptions
* Document data sources
* Share access appropriately
* Keep stakeholders updated