4.2k
+15%
(125)
Conversions
Width
1
1
2
3
4
5
6
2
0
462
24
52
0
25
3
0
1
0
0
0
8
4
0
0
0
42
0
0
5
0
0
0
0
12
0
6
0
0
0
0
0
2
4.2k
+15%
(125)
Conversions
Transactions
120k
+15%
(125)
User activity
32.1k
+15%
(125)

Sign ups
9.8k
+9%
(28)
Data has a new language. Yours.DDaattaa hhaass aa nneeww llaanngguuaaggee.. YYoouurrss..
Basedash is the AI-Native Business Intelligence Platform. Use natural language to generate dashboards, insights, and beautiful charts in seconds. No SQL required.
14 day trial, no credit card required
Data has a new language. Yours.DDaattaa hhaass aa nneeww llaanngguuaaggee.. YYoouurrss..
Basedash is the AI-Native Business Intelligence Platform. Use natural language to generate dashboards, insights, and beautiful charts in seconds. No SQL required.
14 day trial, no credit card required
Data has a new language. Yours.DDaattaa hhaass aa nneeww llaanngguuaaggee.. YYoouurrss..
Basedash is the AI-Native Business Intelligence Platform. Use natural language to generate dashboards, insights, and beautiful charts in seconds. No SQL required.
14 day trial, no credit card required
Trusted by innovative and AI-Native companies
ConnectCCoonnnneecctt
your datayyoouurr ddaattaa
Connect Basedash directly to your database or warehouse to build dashboards and query your data in minutes.

SOC 2 TYPE II Certified
ConnectCCoonnnneecctt
your datayyoouurr ddaattaa
Connect Basedash directly to your database or warehouse to build dashboards and query your data in minutes.
SOC 2 TYPE II Certified
ConnectCCoonnnneecctt
your datayyoouurr ddaattaa
Connect Basedash directly to your database or warehouse to build dashboards and query your data in minutes.
SOC 2 TYPE II Certified
Chat with your dataCChhaatt wwiitthh yyoouurr ddaattaa
With Basedash, everyone can create rich data visualizations and chat with database without needing to know SQL.
 Bar chart of count of users with social links on their profile breakdown by the social link type
 Show number of users broken down by org
 Activity count of all users, using the activity chart type.
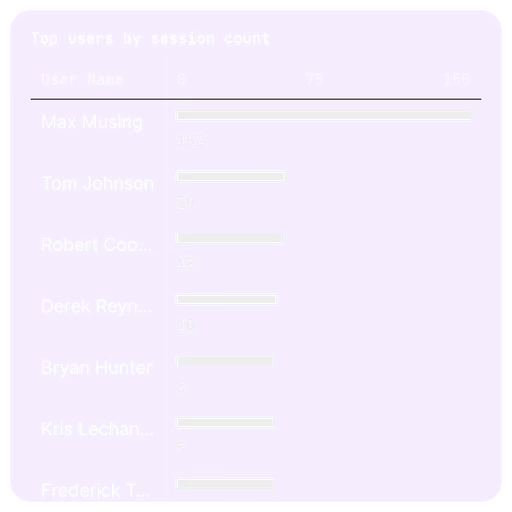
 Who are the top users over the last month?
 Update this chart to work with my new schema
 Activity count of all users, using the activity chart type.
 Pie chart of website visitors broken down by source
 Make a bar chart of errors that the user has come across, broken down by the error type
 What percentage of workspaces have connected Slack?
 Give me a table of most recent comments
 Show who has the most dock items
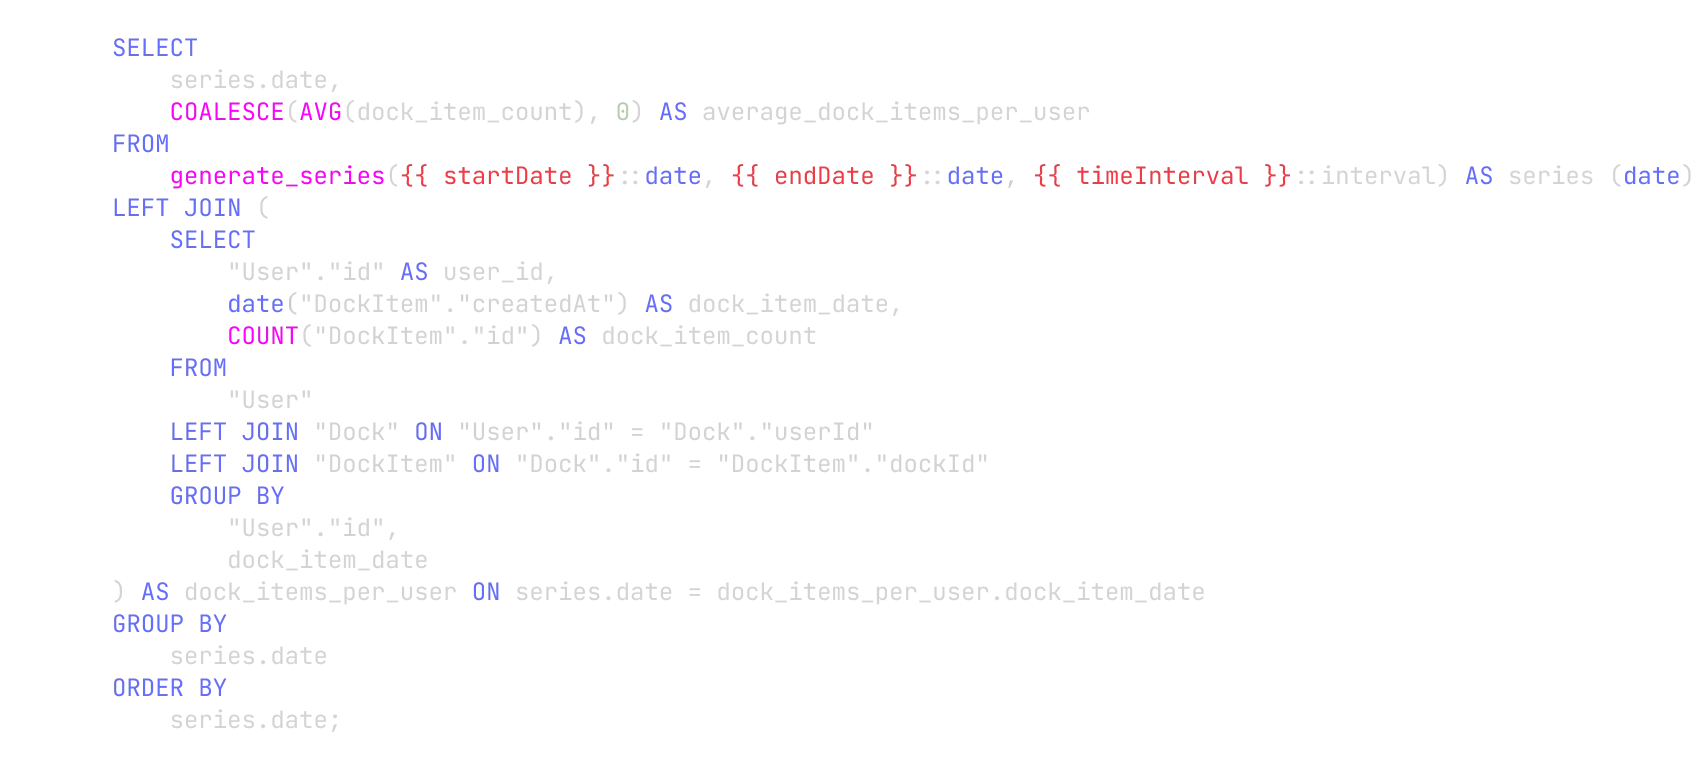
 Fix this query. it was originally written for a different schema + dialect, so it might be totally wrongWhat's my LTV?
 Show users created todayIs there anything in the database that can tell me how many events happened during that session? If so, show it as a new column?
 Pie chart of users by gender
 Who has been the most active this week?Growth of users over time

Low-technical
Just say what you're looking for. If the AI doesn't understand, it will clarify and help you get the data you need.
Custom context
Tell the AI what KPIs, jargon, or internal terminology you use. It'll use them too and understand what you mean.
Agentic
Basedash AI writes multiple queries, resolves errors, and evaluates response data with the latest AI models to look deeply into your data.
Chat with your dataCChhaatt wwiitthh yyoouurr ddaattaa
With Basedash, everyone can create rich data visualizations and chat with database without needing to know SQL.
Chat with your dataCChhaatt wwiitthh yyoouurr ddaattaa
With Basedash, everyone can create rich data visualizations and chat with database without needing to know SQL.
Low-technical
Just say what you're looking for. If the AI doesn't understand, it will clarify and help you get the data you need.
Custom context
Tell the AI what KPIs, jargon, or internal terminology you use. It'll use them too and understand what you mean.
Generate Beautiful DashboardsGGeenneerraattee BBeeaauuttiiffuull DDaasshhbbooaarrddss
In minutes you can generate product, sales, customer success, and marketing dashboards. Choose from 550+ sources. No SQL required.
Business KPIs
Customers
Product
Website
Main KPIs
Last
30d
Daily
Share
Main KPI Dashbaord
Revenue
$19.3K
+15%
($17,840)
400
300
200
100
Aug 1, 2024
Aug 29, 2024
New Subscriptions
1.2K
+103%
(678)
500
250
100
Aug 1, 2024
Aug 29, 2024
CAC
14 wks
Burnrate
$32.5K
Runway in years
2.4
LTV in years
0.8
Cohort retention
480
+4%
(513)
Cohort
Week 1
Week 2
Week 3
Week 4
Week 5
Week 6
1
248
200
140
108
64
25
2
112
104
58
6
2
0
3
168
124
94
76
12
4
4
98
76
51
51
12
14
5
102
155
114
0
0
2


Uses data from:
Generate Beautiful DashboardsGGeenneerraattee BBeeaauuttiiffuull DDaasshhbbooaarrddss
In minutes you can generate product, sales, customer success, and marketing dashboards. Choose from 550+ sources. No SQL required.
KPIs
Customers
Product
Website
Main KPIs
Last
30d
Daily
Share
Main KPI Dashbaord
Revenue
$19.3K
+15%
($17,840)
400
300
200
100
Aug 1, 2024
Aug 29, 2024
New Subscriptions
1.2K
+103%
(678)
500
250
100
Aug 1, 2024
Aug 29, 2024
CAC
14 wks
Burnrate
$32.5K
Runway in years
2.4
LTV in years
0.8
Cohort retention
480
+4%
(513)
Cohort
Week 1
Week 2
Week 3
Week 4
Week 5
Week 6
1
248
200
140
108
64
25
2
112
104
58
6
2
0
3
168
124
94
76
12
4
4
98
76
51
51
12
14
5
102
155
114
0
0
2
Generate Beautiful DashboardsGGeenneerraattee BBeeaauuttiiffuull DDaasshhbbooaarrddss
In minutes you can generate product, sales, customer success, and marketing dashboards. Choose from 550+ sources. No SQL required.
Business KPIs
Customers
Product
Website
Main KPIs
Last
30d
Daily
Share
Main KPI Dashbaord
Revenue
$19.3K
+15%
($17,840)
400
300
200
100
Aug 1, 2024
Aug 29, 2024
New Subscriptions
1.2K
+103%
(678)
500
250
100
Aug 1, 2024
Aug 29, 2024
CAC
14 wks
Burnrate
$32.5K
Runway in years
2.4
LTV in years
0.8
Cohort retention
480
+4%
(513)
Cohort
Week 1
Week 2
Week 3
Week 4
Week 5
Week 6
1
248
200
140
108
64
25
2
112
104
58
6
2
0
3
168
124
94
76
12
4
4
98
76
51
51
12
14
5
102
155
114
0
0
2
Basedash understands your data, so you don't have toBBaasseeddaasshh uunnddeerrssttaannddss yyoouurr ddaattaa,, ssoo yyoouu ddoonn''tt hhaavvee ttoo
Basedash understands your data, so you don't have toBBaasseeddaasshh uunnddeerrssttaannddss yyoouurr ddaattaa,, ssoo yyoouu ddoonn''tt hhaavvee ttoo
Basedash understands your data so you don't have to. Even the most complicated query is just a chat away.
Basedash understands your data so you don't have to. Even the most complicated query is just a chat away.
order_items
order_id
int
item_id
int
item_id
int
product_id
int
quantity
int
list_price
decimal
discount
decimal
quantity
quantity
product_id
product_id
brand_id
brand_id
order_items
order_id
int
item_id
int
item_id
item_id
int
product_id
int
quantity
quantity
int
list_price
decimal
discount
decimal
orders
customer_id
customer_id
order_date
order_date
order_items
customers
first_name
first_name
categories
category_id
int
category_name
int
item_id
int
product_id
int
quantity
int
list_price
decimal
discount
decimal
order_items
first_name
int
last_name
varchar
varchar
phone
varchar
active
active
tinyint
store_id
int
manager_id
int
products
product_id
product_id
brand_id
brand_id
membership
product_id
product_id
brand_id
brand_id
products
product_id
product_id
int
product_name
int
brand_id
brand_id
int
category_id
int
model_year
int
list_price
decimal
discount
decimal
Natural Language
Schema Aware
No need to know the exact table or column name. Just ask, and Basedash will find the right data and chart for your request.
order_items
order_id
int
item_id
int
item_id
int
product_id
int
quantity
int
list_price
decimal
discount
decimal
quantity
quantity
product_id
product_id
brand_id
brand_id
order_items
order_id
int
item_id
int
item_id
item_id
int
product_id
int
quantity
quantity
int
list_price
decimal
discount
decimal
orders
customer_id
customer_id
order_date
order_date
order_items
customers
first_name
first_name
categories
category_id
int
category_name
int
item_id
int
product_id
int
quantity
int
list_price
decimal
discount
decimal
order_items
first_name
int
last_name
varchar
varchar
phone
varchar
active
active
tinyint
store_id
int
manager_id
int
products
product_id
product_id
brand_id
brand_id
membership
product_id
product_id
brand_id
brand_id
products
product_id
product_id
int
product_name
int
brand_id
brand_id
int
category_id
int
model_year
int
list_price
decimal
discount
decimal
Basedash Warehouse
Basedash Warehouse
Visualize data from 600+ productsVViissuuaalliizzee ddaattaa ffrroomm 660000++ pprroodduuccttss
Visualize data from 600+ productsVViissuuaalliizzee ddaattaa ffrroomm 660000++ pprroodduuccttss
Don't have your own warehouse? Use our and make dashboards for analytics, sales, marketing, financial or operations data.
Don't have your own warehouse? Use our and make dashboards for analytics, sales, marketing, financial or operations data.


Instant set up
Just connect your data and Basedash will automatically set up a warehouse for you.
Don't query production data
Don't worry about large or complex queries slowing down your production database and affecting your user's experience
No vendor lock-in
Basedash Warehouse is built on top of ClickHouse, meaning you can migrate away and still retain the all of the data.
Pricing
14 day free trial
$999/mo$$999999//mmoo
Unlimited members
Unlimited dashboards
Unlimited charts
10M records
Slackbot
Enterprise
Contact usCCoonnttaacctt uuss
On-prem deployment
SAML SSO
Onboarding and training
Embedded dashboards
Multiple workspaces
Discounts available for non-profits and YC-backed companies.
Query editor
Powerful SQL editorPPoowweerrffuull SSQQLL eeddiittoorr
Built on the same framework as VS Code, we've made the best possible multiplayer SQL editor for teammates who want to write their own queries. Auto-formatting, variables, version history, and best-in-class autocompletion.
Max
Robert

Professional grade
Lightning fast. 60fps.LLiigghhttnniinngg ffaasstt.. 6600ffppss..
Basedash is opinionated software built in pursuit of high-performance. Keyboard-first design it delivers a focused experience ideal for fast-paced development environments.
Professional grade
Lightning fast. 60fps.LLiigghhttnniinngg ffaasstt.. 6600ffppss..
Basedash is opinionated software built in pursuit of high-performance. Keyboard-first design it delivers a focused experience ideal for fast-paced development environments.
Table explorer
Explore your database like a spreadsheetEExxpplloorree yyoouurr ddaattaabbaassee lliikkee aa sspprreeaaddsshheeeett
Basedash empowers anyone on the team to explore your database with the familiarity of a spreadsheet.
Table explorer
Explore your database like a spreadsheetEExxpplloorree yyoouurr ddaattaabbaassee lliikkee aa sspprreeaaddsshheeeett
Basedash empowers anyone on the team to explore your database with the familiarity of a spreadsheet.
Built on strong foundations
Built on strong foundations

SOC 2
TYPE 2

CLICKHOUSE
OPENAI
RADIX
REMIX
Backed by the best
Backed by the best
Set up in less than 30 minutesSSeett uupp iinn lleessss tthhaann 3300 mmiinnuutteess
Set up in less than 30 minutesSSeett uupp iinn lleessss tthhaann 3300 mmiinnuutteess
Most teams who switch to Basedash can build out all of their existing dashboards from other tools about 30 minutes.
Most users are non-technical.
You don't need to understand your data model.
Just ask, and Basedash will take care of the rest.
Most teams who switch to Basedash can build out all of their existing dashboards from other tools about 30 minutes.
Most users are non-technical.
You don't need to understand your data model.
Just ask, and Basedash will take care of the rest.

© 2025 BaseDash Inc.
© 2025 BaseDash Inc.
© 2025 BaseDash Inc.