Sep 28, 2023

Launch week day 4: Dashboards, segments, time-series
Sep 28, 2023
Welcome to the final day of Basedash launch week.
We saved the best for last: 📈 Dashboards 📊
The name “Basedash” comes from combining two words: Database and Dashboard.
Until now, we’ve focused entirely on accessing and editing data. Today, we’re announcing features that help you build dashboards with that data.
This is all very much a v1, and we’ll be adding more functionality to these features over the coming weeks. We’re excited for you to try them out and let us know what you think.
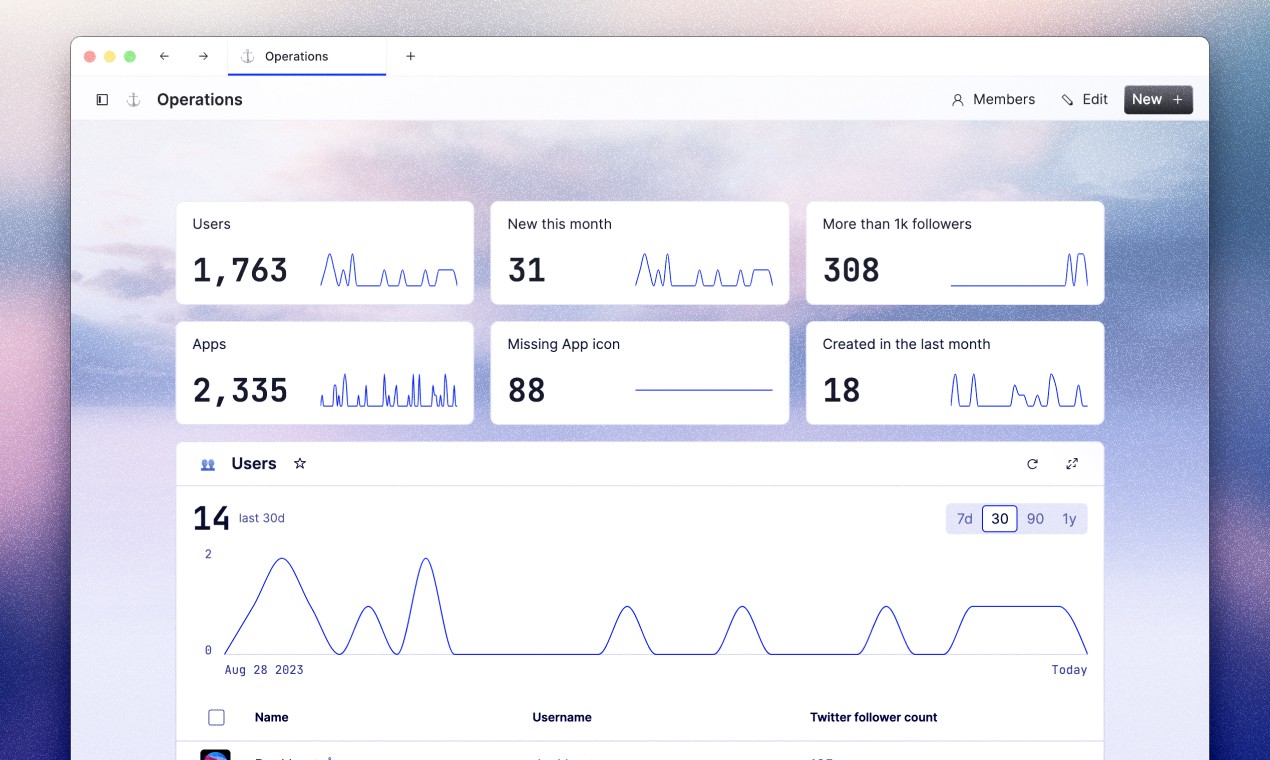
1. Dashboards
With Dashboards, every team in your workspace gets its own customizable page to show things like daily signups, weekly active users, or anything else you might store in your database.
To set up a Dashboard, simply navigate to a Team and click the edit button. When you edit a Team, you’ll notice a new section in the editor called “dashboard cards.” This allows you to select some or all of your existing Views or Queries to pin to the top of your Team page.
By default, each dashboard will appear as a compact card with a metric and corresponding chart. You can edit each card in the side panel to appear as a full view, which will expand the card to display more information.
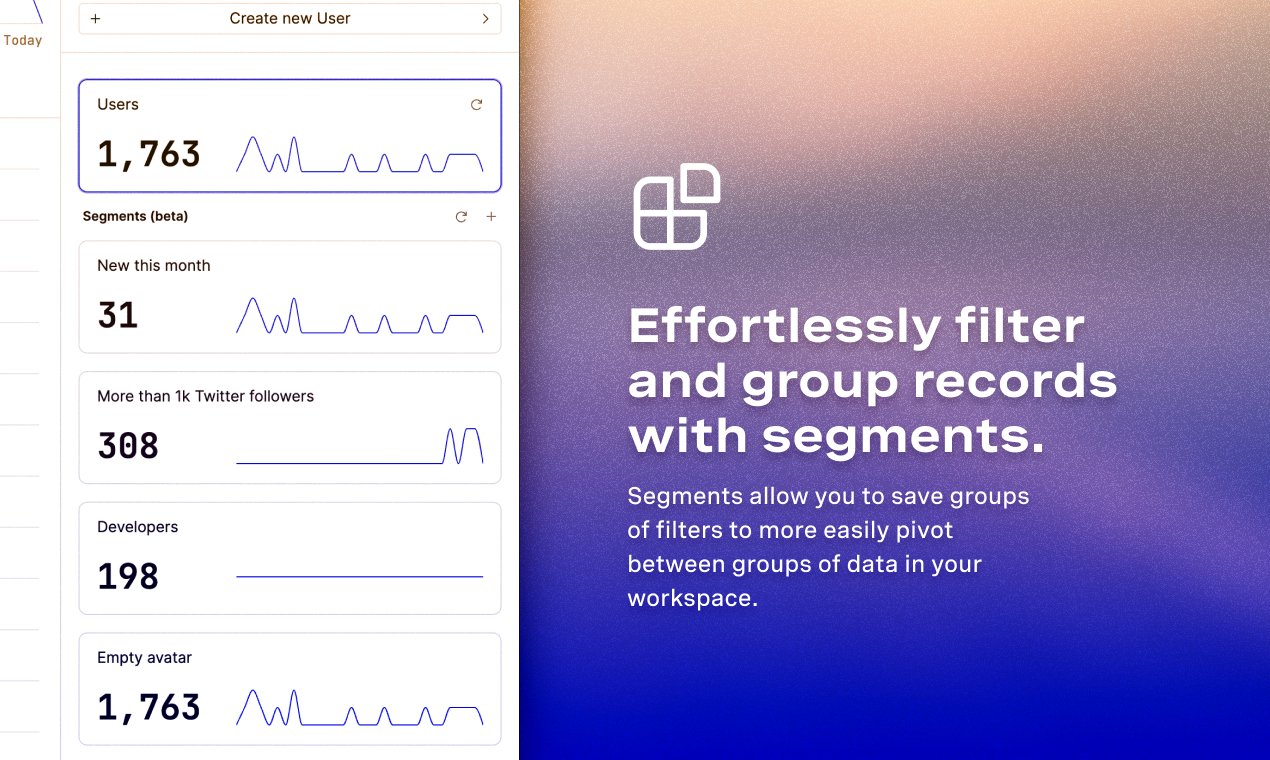
2. Segments
We’ve shipped Segments out of beta. Segments allow you to filter your data and save that as a card in the side panel for a given View. This allows you to jump between different sets of filter in just 1 click.
Previously you would have to consistently duplicate Views or reconfigure filters to that page. Our goal with Segments is to give you and your team access to the granular data you need without having to go through the extra steps of applying new filters or navigating back and forth between otherwise identical pages.
On Dashboards, you can also choose to pin a Segment rather than the full View.
You can also pin segments to your Dashboards.
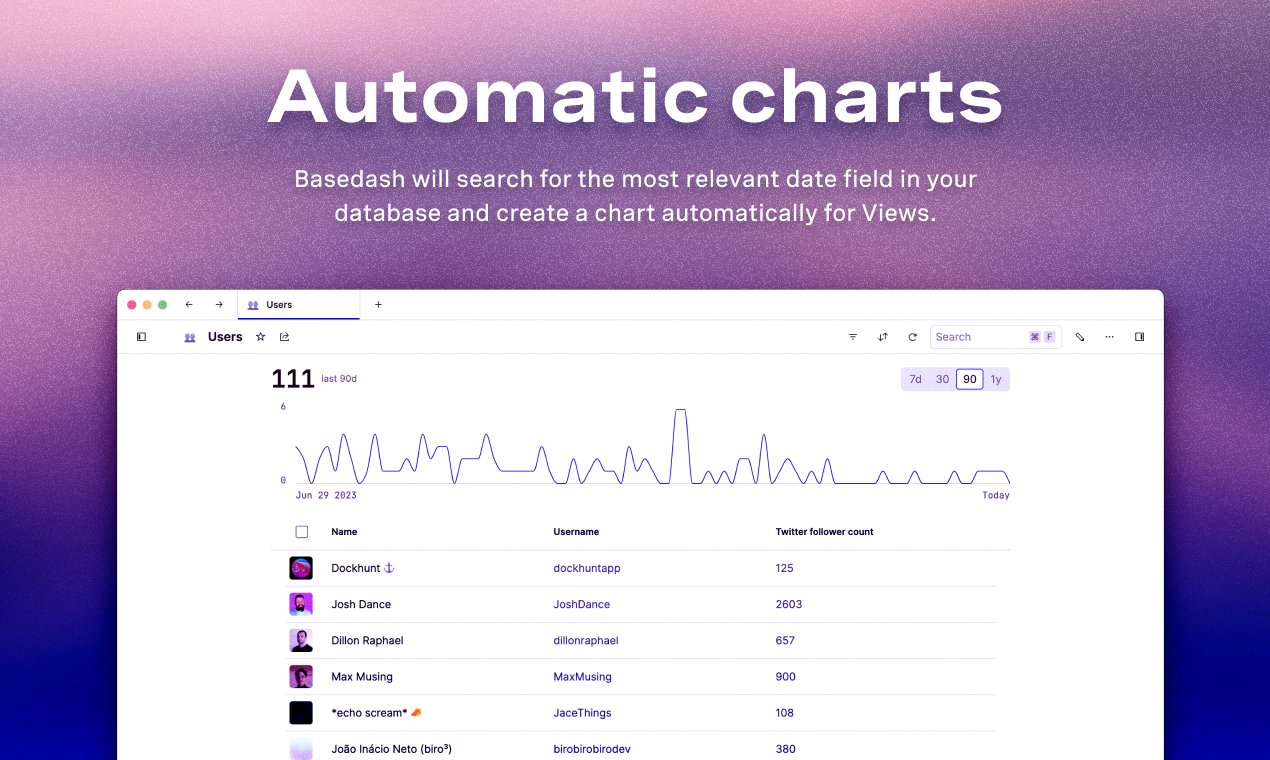
3. Automatic time-series
When you create a View, Basedash will now automatically a time series chart based on your table. This chart will display record creations over time.
For instance, if you create a View of your product’s users, you’ll see a chart at the top of the page that shows a time series of the number of new users over time. This is great if you want to track things like new user signups and quickly understand how they are trending over time.
This requires no configuration. We’ll automatically create these time series charts on any table that has a date column.