
How to dynamically embed custom charts in emails
October 21, 2023
It’s tricky to embed visual elements like charts in emails. Emails aren’t like web pages; they come with their own set of quirks. But since you’ll still obviously want to convey your data visually, we put together this guide to help you get around the limitations of email.
The challenge with email environments
Embedding charts in email isn’t straightforward. Email clients, unlike web browsers, are restrictive when it comes to rendering HTML and JavaScript. You can't just drop a Chart.js or D3.js script into your email template and expect it to render correctly.
Instead, most email clients support a subset of HTML and CSS, which means we can create an image representation of our chart and embed it within the email.
How to embed custom charts
Generate a chart image on the server-side
The first step in the process is to generate an image of your chart. There are a couple of libraries, depending on the server-side language you're using, that allow for this:
- Node.js: Use a combination of Chart.js with the 'canvas' package.
- Python: You can use libraries like Matplotlib or Seaborn.
- Ruby: The Gruff gem is a solid option.
Let’s try Node.js:
const { createCanvas } = require('canvas');
const ChartjsNode = require('chartjs-node');

const chartNode = new ChartjsNode(600, 400);

const chartData = {
   type: 'bar',
   data: {
      labels: ['Red', 'Blue', 'Yellow', 'Green', 'Purple', 'Orange'],
      datasets: [{
         label: 'Favorite Colors',
         data: [12, 19, 3, 5, 2, 3],
      }]
   }
};

chartNode.drawChart(chartData)
   .then(() => chartNode.getImageBuffer('image/png'));
Upload the image to a CDN
Once the chart is converted into an image, upload it to a Content Delivery Network (CDN). Using a CDN ensures that the image loads quickly regardless of the recipient's location. Amazon S3, Cloudinary, and Firebase are good options.
const AWS = require('aws-sdk');
const s3 = new AWS.S3();

const uploadParams = {
   Bucket: 'YOUR_BUCKET_NAME',
   Key: 'chart.png',
   Body: imageBuffer,
   ContentType: 'image/png'
};

s3.upload(uploadParams, (err, data) => {
   if (err) throw err;
   console.log(`Chart uploaded to: ${data.Location}`);
});
Emded the image in the email
After uploading the image, embed it into the email content using a simple <img> tag. Ensure you use the URL provided by the CDN.
<html>
   <body>
      <h2>Your Monthly Performance</h2>
      <img src="CDN_IMAGE_URL" alt="Chart showing monthly performance">
      <p>Thank you for your hard work!</p>
   </body>
</html>
You could ship faster.
Imagine the time you'd save if you never had to build another internal tool, write a SQL report, or manage another admin panel again. Basedash is built by internal tool builders, for internal tool builders. Our mission is to change the way developers work, so you can focus on building your product.
Other things to consider
Responsive design
Ensure the chart image looks good on all devices. Consider generating multiple sizes or using vector formats like SVG.
Fallback options
Always include alternative text (alt attribute) for the image. If the image fails to load, the recipient will at least have a description of the content.
Optimization
Compress the image to ensure that it loads quickly and doesn't eat up a lot of the recipient's data.
Caching
Ensure your CDN caches the images for optimal performance.
Conclusion
Dynamically embedding custom charts in emails is a blend of art and technology. While we're limited by email client capabilities, with a server-side approach, we can still convey crucial data visually.
TOC
October 21, 2023
It’s tricky to embed visual elements like charts in emails. Emails aren’t like web pages; they come with their own set of quirks. But since you’ll still obviously want to convey your data visually, we put together this guide to help you get around the limitations of email.
The challenge with email environments
Embedding charts in email isn’t straightforward. Email clients, unlike web browsers, are restrictive when it comes to rendering HTML and JavaScript. You can't just drop a Chart.js or D3.js script into your email template and expect it to render correctly.
Instead, most email clients support a subset of HTML and CSS, which means we can create an image representation of our chart and embed it within the email.
How to embed custom charts
Generate a chart image on the server-side
The first step in the process is to generate an image of your chart. There are a couple of libraries, depending on the server-side language you're using, that allow for this:
- Node.js: Use a combination of Chart.js with the 'canvas' package.
- Python: You can use libraries like Matplotlib or Seaborn.
- Ruby: The Gruff gem is a solid option.
Let’s try Node.js:
const { createCanvas } = require('canvas');
const ChartjsNode = require('chartjs-node');

const chartNode = new ChartjsNode(600, 400);

const chartData = {
   type: 'bar',
   data: {
      labels: ['Red', 'Blue', 'Yellow', 'Green', 'Purple', 'Orange'],
      datasets: [{
         label: 'Favorite Colors',
         data: [12, 19, 3, 5, 2, 3],
      }]
   }
};

chartNode.drawChart(chartData)
   .then(() => chartNode.getImageBuffer('image/png'));
Upload the image to a CDN
Once the chart is converted into an image, upload it to a Content Delivery Network (CDN). Using a CDN ensures that the image loads quickly regardless of the recipient's location. Amazon S3, Cloudinary, and Firebase are good options.
const AWS = require('aws-sdk');
const s3 = new AWS.S3();

const uploadParams = {
   Bucket: 'YOUR_BUCKET_NAME',
   Key: 'chart.png',
   Body: imageBuffer,
   ContentType: 'image/png'
};

s3.upload(uploadParams, (err, data) => {
   if (err) throw err;
   console.log(`Chart uploaded to: ${data.Location}`);
});
Emded the image in the email
After uploading the image, embed it into the email content using a simple <img> tag. Ensure you use the URL provided by the CDN.
<html>
   <body>
      <h2>Your Monthly Performance</h2>
      <img src="CDN_IMAGE_URL" alt="Chart showing monthly performance">
      <p>Thank you for your hard work!</p>
   </body>
</html>
You could ship faster.
Imagine the time you'd save if you never had to build another internal tool, write a SQL report, or manage another admin panel again. Basedash is built by internal tool builders, for internal tool builders. Our mission is to change the way developers work, so you can focus on building your product.

Other things to consider
Responsive design
Ensure the chart image looks good on all devices. Consider generating multiple sizes or using vector formats like SVG.
Fallback options
Always include alternative text (alt attribute) for the image. If the image fails to load, the recipient will at least have a description of the content.
Optimization
Compress the image to ensure that it loads quickly and doesn't eat up a lot of the recipient's data.
Caching
Ensure your CDN caches the images for optimal performance.
Conclusion
Dynamically embedding custom charts in emails is a blend of art and technology. While we're limited by email client capabilities, with a server-side approach, we can still convey crucial data visually.
October 21, 2023
It’s tricky to embed visual elements like charts in emails. Emails aren’t like web pages; they come with their own set of quirks. But since you’ll still obviously want to convey your data visually, we put together this guide to help you get around the limitations of email.
The challenge with email environments
Embedding charts in email isn’t straightforward. Email clients, unlike web browsers, are restrictive when it comes to rendering HTML and JavaScript. You can't just drop a Chart.js or D3.js script into your email template and expect it to render correctly.
Instead, most email clients support a subset of HTML and CSS, which means we can create an image representation of our chart and embed it within the email.
How to embed custom charts
Generate a chart image on the server-side
The first step in the process is to generate an image of your chart. There are a couple of libraries, depending on the server-side language you're using, that allow for this:
- Node.js: Use a combination of Chart.js with the 'canvas' package.
- Python: You can use libraries like Matplotlib or Seaborn.
- Ruby: The Gruff gem is a solid option.
Let’s try Node.js:
const { createCanvas } = require('canvas');
const ChartjsNode = require('chartjs-node');

const chartNode = new ChartjsNode(600, 400);

const chartData = {
   type: 'bar',
   data: {
      labels: ['Red', 'Blue', 'Yellow', 'Green', 'Purple', 'Orange'],
      datasets: [{
         label: 'Favorite Colors',
         data: [12, 19, 3, 5, 2, 3],
      }]
   }
};

chartNode.drawChart(chartData)
   .then(() => chartNode.getImageBuffer('image/png'));
Upload the image to a CDN
Once the chart is converted into an image, upload it to a Content Delivery Network (CDN). Using a CDN ensures that the image loads quickly regardless of the recipient's location. Amazon S3, Cloudinary, and Firebase are good options.
const AWS = require('aws-sdk');
const s3 = new AWS.S3();

const uploadParams = {
   Bucket: 'YOUR_BUCKET_NAME',
   Key: 'chart.png',
   Body: imageBuffer,
   ContentType: 'image/png'
};

s3.upload(uploadParams, (err, data) => {
   if (err) throw err;
   console.log(`Chart uploaded to: ${data.Location}`);
});
Emded the image in the email
After uploading the image, embed it into the email content using a simple <img> tag. Ensure you use the URL provided by the CDN.
<html>
   <body>
      <h2>Your Monthly Performance</h2>
      <img src="CDN_IMAGE_URL" alt="Chart showing monthly performance">
      <p>Thank you for your hard work!</p>
   </body>
</html>
You could ship faster.
Imagine the time you'd save if you never had to build another internal tool, write a SQL report, or manage another admin panel again. Basedash is built by internal tool builders, for internal tool builders. Our mission is to change the way developers work, so you can focus on building your product.

Other things to consider
Responsive design
Ensure the chart image looks good on all devices. Consider generating multiple sizes or using vector formats like SVG.
Fallback options
Always include alternative text (alt attribute) for the image. If the image fails to load, the recipient will at least have a description of the content.
Optimization
Compress the image to ensure that it loads quickly and doesn't eat up a lot of the recipient's data.
Caching
Ensure your CDN caches the images for optimal performance.
Conclusion
Dynamically embedding custom charts in emails is a blend of art and technology. While we're limited by email client capabilities, with a server-side approach, we can still convey crucial data visually.
What is Basedash?
What is Basedash?
What is Basedash?
Ship faster, worry less with Basedash
Ship faster, worry less with Basedash
Ship faster, worry less with Basedash
You're busy enough with product work to be weighed down building, maintaining, scoping and developing internal apps and admin panels. Forget all of that, and give your team the admin panel that you don't have to build. Launch in less time than it takes to run a standup.
You're busy enough with product work to be weighed down building, maintaining, scoping and developing internal apps and admin panels. Forget all of that, and give your team the admin panel that you don't have to build. Launch in less time than it takes to run a standup.
You're busy enough with product work to be weighed down building, maintaining, scoping and developing internal apps and admin panels. Forget all of that, and give your team the admin panel that you don't have to build. Launch in less time than it takes to run a standup.
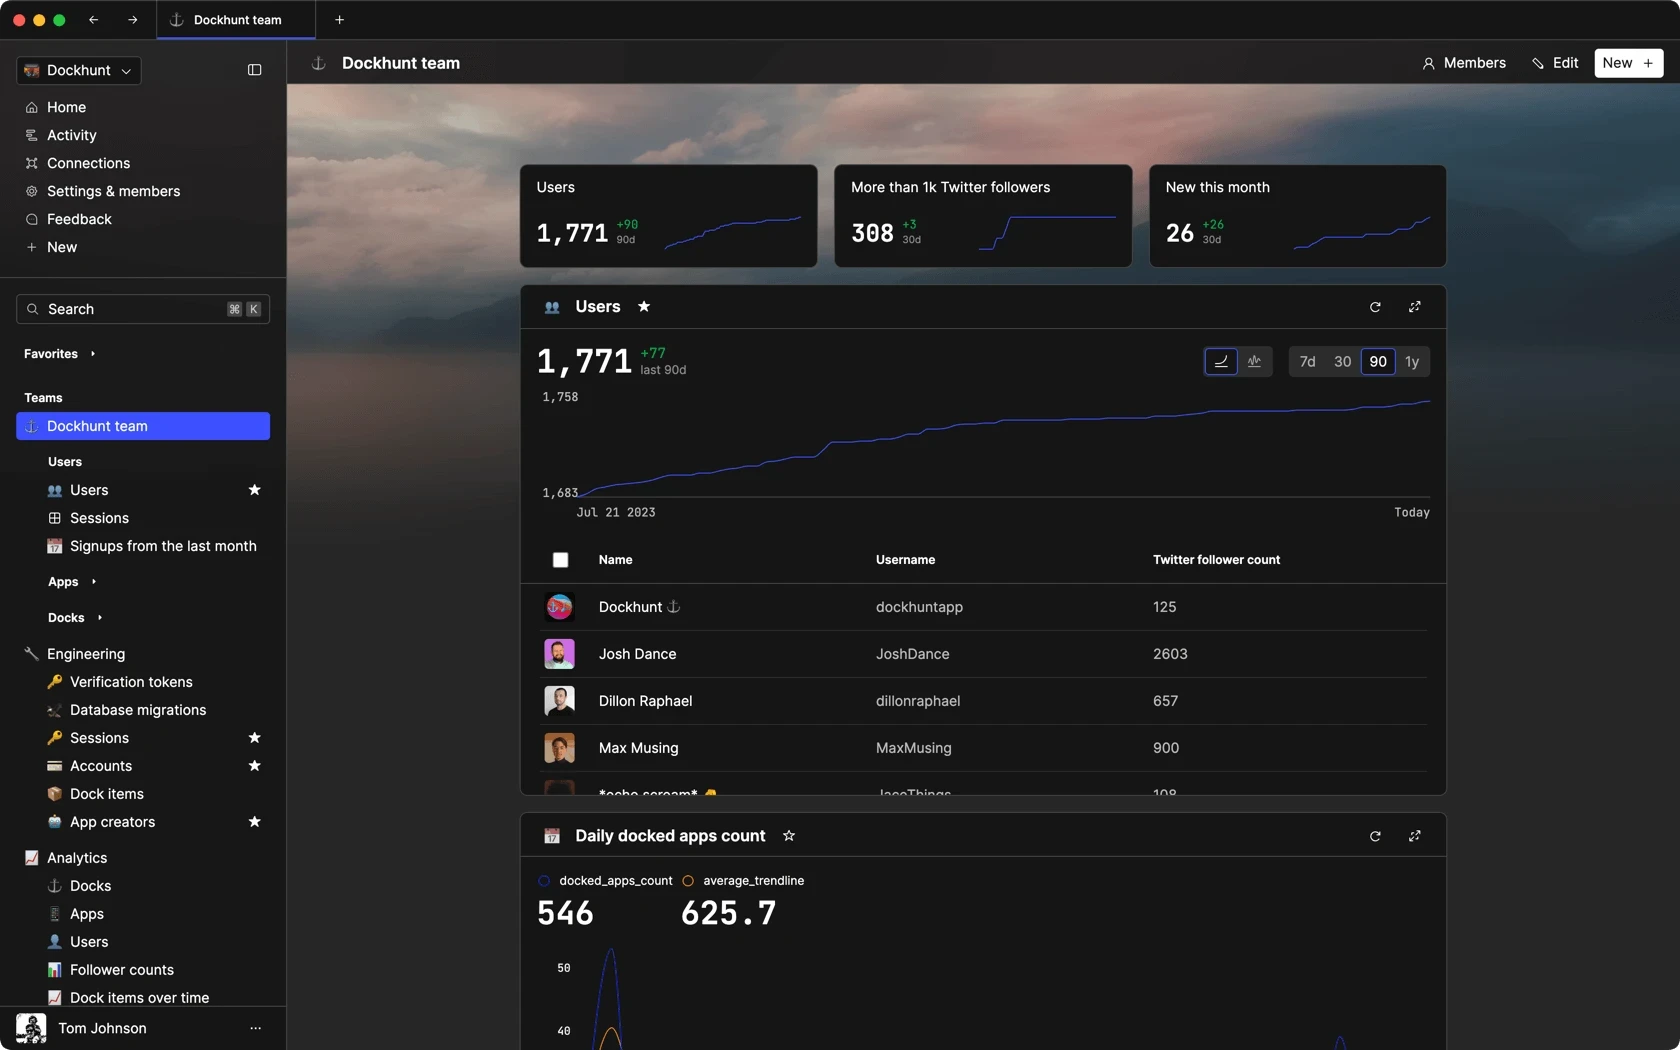
Dashboards and charts
Edit data, create records, oversee how your product is running without the need to build or manage custom software.
USER CRM
ADMIN PANEL
SQL COMPOSER WITH AI
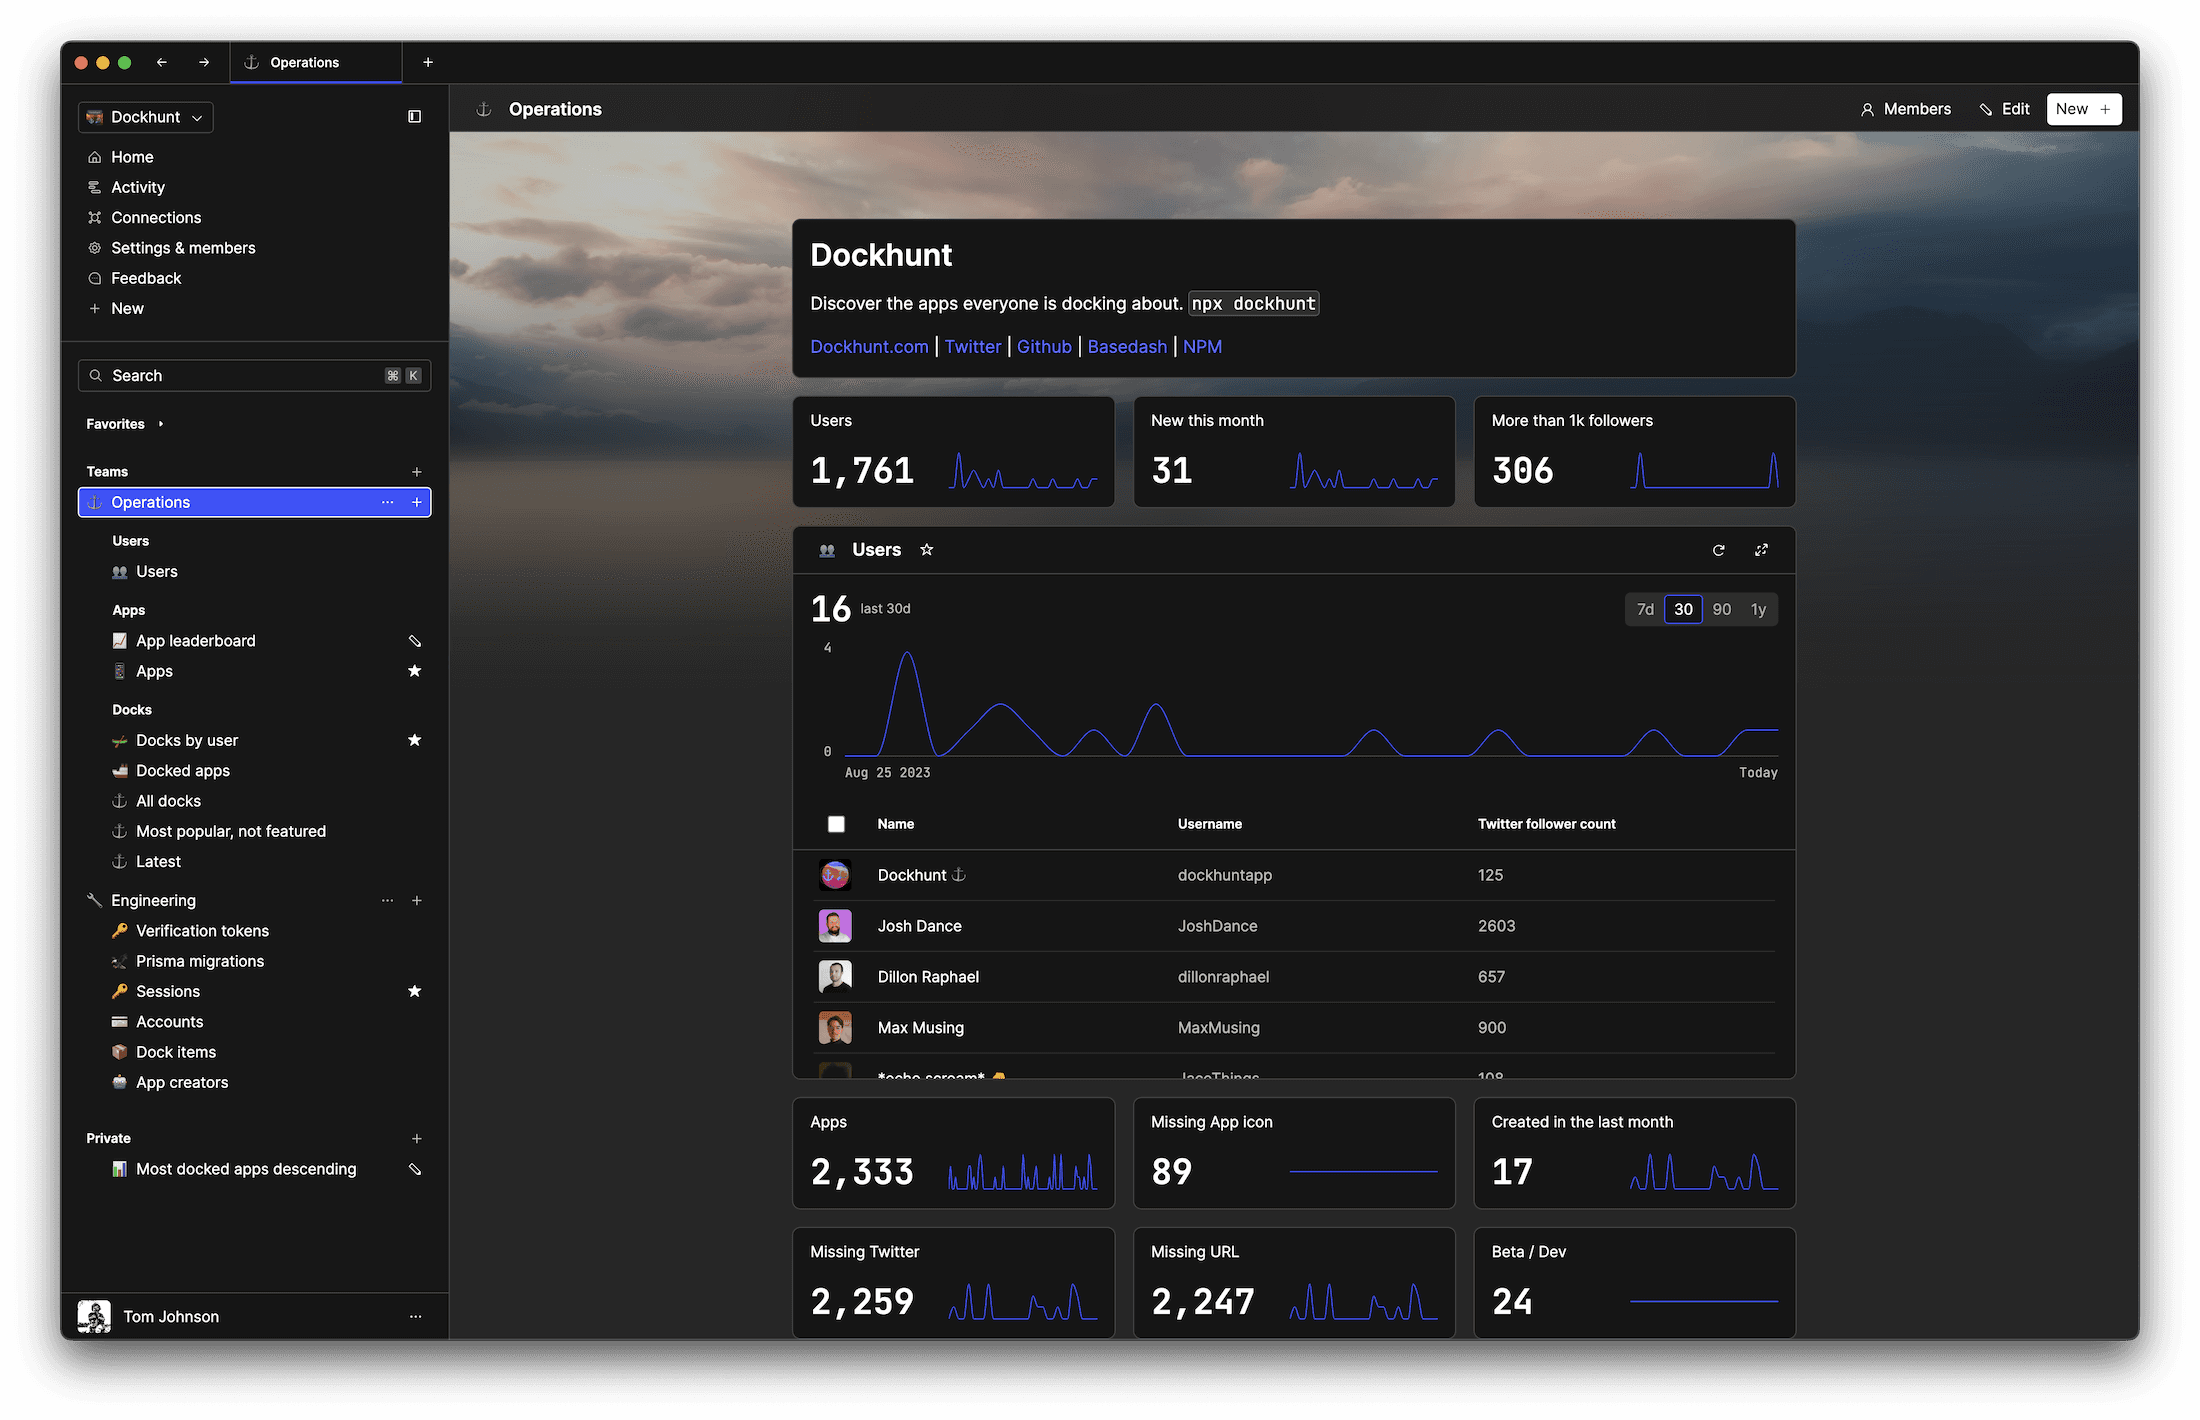
Related posts
Related posts
Related posts


How to Center a Table in HTML with CSS
Jeremy Sarchet


Adjusting HTML Table Column Width for Better Design
Robert Cooper


How to Link Multiple CSS Stylesheets in HTML
Robert Cooper


Mastering HTML Table Inline Styling: A Guide
Max Musing


HTML Multiple Style Attributes: A Quick Guide
Max Musing



How to Set HTML Table Width for Responsive Design
Max Musing
