Skip to content

June 19, 2026

More control over how your charts look

You can now set a custom color for single-series charts. Line, bar, funnel, and scatter charts that don’t have a breakdown get a dedicated Series color setting, so you’re no longer stuck with the default and can match a chart to your brand, your dashboard, or whatever convention your team already uses.

Numeric charts also get a new Show full numbers toggle. By default Basedash keeps big values compact (like 1.2M), but when you need the exact figure you can flip a chart to show the full number in the primary value and data labels while keeping the axis labels compact and readable. It’s an easy way to make number and KPI charts precise without cluttering the rest of the chart.

Dashboards stay visible while their data refreshes

Charts on dashboards now render their cached data immediately, even when that data is due for a refresh. Instead of blocking on a fresh query and leaving you looking at a loading state, Basedash shows the most recent results right away and kicks off the refresh in the background, swapping in new rows the moment they’re ready.

The refresh itself moved off the web request and onto a dedicated background job, with duplicate refreshes for the same query collapsed into one. The chart header keeps a subtle spinner (with an “Updating data from…” tooltip) while a refresh is in flight, so you always know whether you’re looking at the latest numbers—without the dashboard ever going blank on you.

A cleaner, smarter AI chat

The AI chat’s thinking steps got a visual refresh. Reasoning summaries now render inline as plain text—like preambles—instead of hiding behind an expandable “Reasoning summary” row, so the assistant’s train of thought reads naturally as it works. Tool steps that still have details to expand got tidied up too, with a lighter row style and a caret that only appears on hover.

The assistant can also maintain durable memory more precisely. When it learns something worth keeping, it can make targeted edits to your organization’s global AI context—not just append to it—and each change comes with a short, human-readable description of what it updated, so it’s clear what the assistant chose to remember.

Fixes and improvements

  • Added a Copy → SQL action to charts in chat, so you can grab the underlying query and drop it into the chat input in one step.
  • Let the chart assistant set and update a chart’s description when editing it.
  • Added hover tooltips, a crosshair, and clearer legend and segment interactions to the AI usage charts in billing settings.
  • Fixed vertical bars overlapping on time-series charts with sparse, clustered dates.
  • Fixed setup for Fivetran file connectors like Google Drive so Magic Folder connectors create correctly.
  • Made chat handle files that can no longer be retrieved more gracefully instead of surfacing a generic error.
June 12, 2026

Export to Excel

You can now export to Excel (.xlsx) anywhere you could already export data. Charts, tables, markdown tables, and in-browser record views all get a native Excel option right alongside CSV, so the data you pull out of Basedash lands in a real spreadsheet—formatted columns and all—instead of a raw text file you have to clean up first.

Exports stream from the server and page through large result sets, so even big tables download reliably without choking the browser. If your team lives in spreadsheets, this is one fewer copy-paste step between a Basedash query and the workbook you actually share.

More control over embedded Basedash

If you embed the full Basedash app inside your own product, you can now tailor what your users see with two new URL params: hide_chat and hide_dashboards. Hide the chat experience, hide the dashboards section, or hide both to scope the embed down to exactly the surface you want to expose.

Basedash automatically lands embedded users on the first feature that’s still visible, and your choices carry through as users navigate inside the embed—so there are no dead ends or empty sidebar sections. It’s a simple way to ship a more focused, on-brand embedded experience without custom work.

Filter dropdowns now populate on shared dashboards

Filter dropdowns on publicly shared and embedded dashboards now load their options the way they do inside the app. Both SQL-backed and record-backed filter dropdowns return their choices, so viewers of a shared dashboard can actually pick a value and filter instead of staring at an empty menu.

We did this without loosening anything: Basedash only ever resolves dropdowns for the in-scope, visible variables on the dashboard or chart you’re viewing, and hidden, cross-dashboard, and cross-organization queries stay locked down.

Fixes and improvements

  • Restored file-based Fivetran connectors (like S3 and SFTP) so they create and sync correctly again.
  • Fixed chart images in insight emails and Slack so they render with the correct row-level-security context instead of showing the wrong data.
  • Made Connection issues sidebar rows link straight to the data source page instead of opening the command menu.
  • Restricted creating, updating, and force-syncing data source connections to organization admins.
  • Fixed padding on the Basedash warehouse access settings section so it matches other data source access sections.
June 5, 2026

SQL definitions: reusable snippets across your queries

You can now create SQL definitions scoped to a database connection—versioned, named SQL snippets that you can reference inline in any query with {{ definition("name") }}. Definitions get their own home in the Data page sidebar where you can create, edit, describe, and preview them, and the expansion is applied both for human-run queries and for queries the chat agent runs on your behalf.

The chat agent understands definitions too, so when it writes SQL it can reach for your team’s definitions automatically. Admins can also let the agent propose and save new definitions when it spots a pattern worth keeping around—so the SQL your team relies on becomes a real, reusable building block instead of something everyone re-types.

AI context now flows from groups

You can give a group its own AI context, and it now flows into chat, chart-editing, and automation agents whenever a member of that group is interacting. If different teams think about your data differently—engineering versus sales versus finance—you can finally encode that nuance per team without trying to cram it all into one global context block.

Chart agents spawned from inside a dashboard also now inherit the dashboard’s AI context, so editing a chart in place picks up the same guidance the dashboard agent has.

Billing got more transparent

The billing settings page got two new sections aimed at admins who actually need to reason about cost:

  • Invoices lists recent Stripe invoices for the org with date, amount, status, and a hosted link straight to the invoice—no more bouncing into Stripe just to grab a PDF.
  • The AI usage sections now have a billing period selector, so you can review totals and per-member breakdowns from any past period (capped to when your org was created). The current-period overage warning stays scoped to today’s period, so historical browsing doesn’t surface old warnings.

Skills and definitions join the public API

Following recent additions for Insights, automations, members, AI usage, data source access, and MCP servers, the public API now covers two more building blocks:

  • Skills: list, create, fetch, update, and archive AI skills via /api/public/organizations/{orgId}/skills.
  • Definitions: full CRUD for SQL definitions via /api/public/organizations/{orgId}/definitions.

If you’re provisioning Basedash from your own tools—or syncing skills and definitions from a runbook or repo—you can now keep both fully in sync from outside the app.

Fixes and improvements

  • Returned typed structured payloads from the Basedash MCP server’s ask_question and get_data_sources tools, so MCP clients can consume them without parsing text.
  • Fixed an MCP OAuth issue where rotating a refresh token could prematurely invalidate a still-valid access token.
  • Tightened up the OAuth metadata the MCP server advertises, including bearer header support, resource name, and protected resource linkage.
  • Capped the pie chart center metric at the standard number-chart size so it no longer balloons in larger charts.
May 29, 2026

Oracle is now a native data source

You can now connect Oracle as a direct database connection alongside Postgres, MySQL, SQL Server, and the rest. Connections use node-oracledb in Thin mode, so there’s no Oracle Instant Client install to babysit—standard host/port/service-name (and SSL/SSH-tunnel) connections work out of the box, and schema introspection runs through the ALL_* views the way you’d expect.

The chat agent knows about Oracle SQL gotchas, the connection picker shows the Oracle logo inline, and we hid the Airbyte Oracle DB connector now that there’s a first-class native option that talks directly to your database.

MCP servers join the public API

The public API now covers MCP servers end-to-end: you can list, create, update, fetch, and delete the MCP connectors attached to an organization through /api/public/organizations/{orgId}/mcp-servers. This closes one of the larger gaps after last week’s automations, members, AI usage, and data source access endpoints.

If you provision Basedash from your IDP or runbooks, you can now keep MCP server configs in sync from outside the app—useful for environments where every connector needs to be reviewable and reproducible.

Insights got more flexible

Insights schedules now include a “Never” option. Turn off automatic generation entirely while keeping Insights enabled so people on your team can still trigger them manually from the app—useful for trial accounts and for orgs that only want Insights on demand.

The public Insights API also now returns a rendered chart image URL alongside each insight’s chart, reusing the same cached screenshot the in-app and Slack/email surfaces use. If you’re piping Insights into your own tools or docs, you no longer have to render the chart yourself to embed the visual.

Data source pages keep getting better

We polished the data source detail page another pass. Renaming now happens through the command menu everywhere instead of inline-editing the title, the overflow actions in the sidebar and page headers were consolidated into one consistent menu, and direct SQL connections get a dialect-aware Connection details section with blurred-until-revealed credentials, masked secrets, and a one-click warehouse password reveal. Airbyte connectors can now load their full spec/config on demand with the same secret-masking treatment, and Fivetran connectors got a cleaner “managed in Fivetran” block.

If you belong to multiple organizations, the login flow now lands you in the alphabetically-first org instead of an arbitrary one, so the default destination is predictable.

The chat agent can manage its own skills

The chat agent can now create, update, and delete AI skills directly. When you tell it something worth remembering—a recurring instruction, a domain convention, or a piece of business context—it can save that as a durable, reusable skill (with a generated routing description) instead of relying on you to add it manually in settings.

We also generate routing descriptions for new and renamed skills automatically, which improves how the agent picks the right skill on each turn—so skills you’ve already created should kick in more reliably.

Fixes and improvements

  • Surfaced chat file upload errors with a clear toast and preserved the user’s draft and selected attachment, instead of swallowing the failure silently.
  • Fixed chat attachment submission so failed uploads no longer wipe the composer and you can retry without re-attaching the file.
  • Fixed an Insights cron edge case where a top-of-hour fan-out across multiple pods could publish the same insight twice on the same day.
  • Fixed shared chart exports on public dashboards so JWT-locked variables and legacy variable names round-trip correctly through CSV/Excel exports.
  • Paginated schema sync so very large warehouses sync reliably without stalling the event loop on big table sets.
  • Added a realistic example payload to the public Insights API spec so the generated docs show what an insight response actually looks like.
May 22, 2026

Filter individual charts independently from dashboards

Chart filters can now be scoped to a single chart instead of the whole dashboard. You decide whether a filter applies dashboard-wide or just to one chart, and you can promote a chart-level filter to the dashboard or demote a dashboard filter back to a single chart whenever you want to rearrange things.

This makes dashboards with mixed analytic surfaces much more workable—one chart can have its own time range or status filter while the rest of the dashboard keeps using its defaults, without forking the underlying SQL.

Embed individual charts, not just dashboards

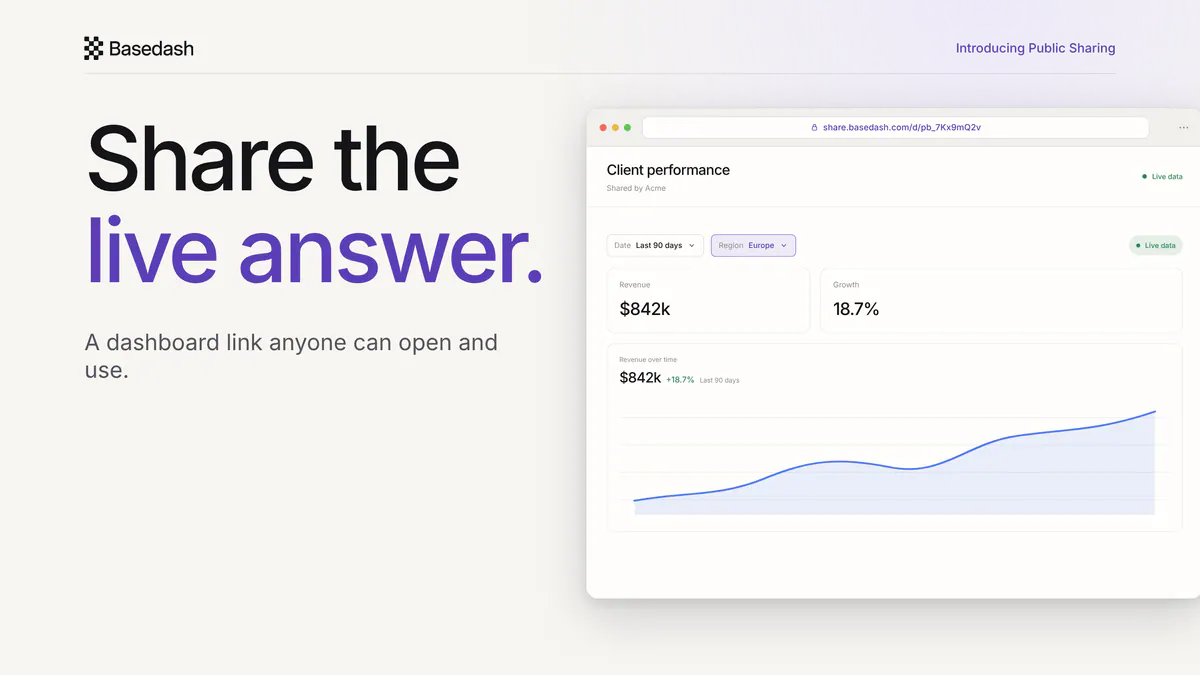
Public sharing now works at the chart level. Open the share popover on a chart that lives in a publicly shared dashboard and you’ll get a link and iframe snippet you can drop into your own product, docs, or internal tools. The embedded chart renders full-bleed, supports any chart-scoped filters you’ve configured, and keeps a small “Made in Basedash” badge in the corner.

Inherited dashboard access is shown read-only in the popover so it’s obvious who can already see the chart, and the embed strips app chrome (sidebar and chat toggles) while keeping the chart’s own filter controls visible.

Data source pages got a major rework

Connector homepages now live in the main content area with inline editing for everything: AI context autosaves on blur, access is managed with the same share-popover pattern as dashboards (everyone / group / member rows with their own permission dropdowns), and the danger zone is a type-to-confirm field that flips the delete button from secondary to primary the moment you type the right name. Sync moved out of the page header and into the sidebar footer, and switching between data sources of the same type no longer leaves your scroll position in a strange place.

Warehouse credentials are now obscured by default behind a “Show credentials” overlay with per-field copy buttons (including the password once it’s fetched), so it’s harder to accidentally leak secrets while screen-sharing. Settings pages also got fresher empty states, consistent section subtitles, and a unified AI context textarea.

The public API now covers most of Basedash

Following last week’s Insights API, this week the public API adds endpoints for automations (list, create, update, archive, fetch, plus run management), members (invite by email and update role or profile), AI usage (current billing-period totals plus a per-member breakdown), and data source access (read or replace the policy with either “everyone” or restricted groups and members).

Together with Insights, this means you can wire most of Basedash’s surface area into your own tools—pin reports into a runbook, drive provisioning from your IDP, monitor AI spend, or audit who can query what.

Slack and email responses now ship with chart images

Slack chat replies and automation notifications (Slack and email) now include rendered chart screenshots inline, matching the flow that already ships for Insights. When the chat agent or an automation generates a chart, the image is placed right where the chart appears in the response, so you can see the answer directly in the thread or message without clicking through to Basedash.

Chart screenshots are also now rendered at 2× device scale, so the visuals look noticeably sharper in Slack messages, email digests, and anywhere else server-side renders show up.

Fixes and improvements

  • Fixed Google sign-in so it works on the first try instead of occasionally bouncing users back to the login page.
  • Recovered chats that got stuck mid-generation by adding an automatic recovery sweep, so the message composer no longer stays disabled after a thinking step finishes.
  • Added a Slack disclaimer message that posts automatically when the Basedash app is added to a Slack channel, so everyone in the channel knows what to expect.
  • Filtered the Slack private channel picker so it only shows channels the configuring user actually belongs to.
  • Capped Slack messages at Slack’s 50-block limit with a clean truncation footer instead of failing to post long responses.
  • Added horizontal scrolling for dashboard filter rows so long filter sets no longer break the header layout.
  • Improved dropdown option rendering when a filter’s label and value differ, with smarter width splitting and full-text hover.
  • Fixed multi-select filter handling when option values contain commas so selections round-trip correctly.
  • Always show number chart titles on public sharing links, matching the in-app behavior.
  • Tightened line chart stroke widths for a cleaner look at typical chart sizes.
  • Fixed markdown blockquotes (and inline code, bold, italic, and links) so they’re legible in dark Insight and automation emails.
  • Required explicit confirmation, including the resource type, when deleting data sources, with case-insensitive matching.
  • Changed the default role for invited members from “inherit from inviter” to “Member” so admins are no longer created by accident.
  • Fixed Fivetran destinations failing when an organization name starts with a number.
  • Fixed Postgres JSONB queries using -> and ->> getting mangled by pagination logic on cached connections.
  • Fixed the chat agent retrieving stale chart context when dashboard context was too large to inline.
  • Fixed inline chat charts that reference dashboards so they pick up the correct dashboard date defaults and variable values.
  • Stopped surfacing unhandled errors when chat message prefetching failed transiently.
  • Eliminated repeated 404 spam from /connections//{schemas,tables} requests when no connection was selected.
  • Fixed chart screenshot rendering in production so Slack and email chart images render reliably.