Introducing the Basedash developer platform
Max Musing
 Max MusingFounder and CEO of Basedash
· July 24, 2026
Max MusingFounder and CEO of Basedash
· July 24, 2026
Max Musing
Max MusingFounder and CEO of Basedash
· July 24, 2026
Today we’re launching the Basedash developer platform, which makes everything Basedash does available through the API.
Over the past year we’ve shipped an AI data analyst you can chat with, automatic daily insights, automations that deliver reports on a schedule, and dashboards that build themselves. All of it was built for internal teams. As of today, all of it is programmable. You can create chats, stream the analyst’s answers, render the charts it builds, and manage dashboards and automations from your own code, inside your own product and UI.
Two requests kept coming up, from opposite directions.
Product teams told us: “Our customers keep asking for analytics. We trust the Basedash analyst internally. Can we put it in front of our customers?” Building customer-facing analytics from scratch is a brutal project: a query layer, charting, permissions, multi-tenant isolation, and now (because every customer expects it) an AI analyst that gets answers right. That’s quarters of work before you ship anything.
Data teams told us the opposite: “We love the product, but we want to drive it from our own systems.” They wanted to trigger an analysis from a support ticket, render a chart into an internal tool, or wire insights into a workflow no BI vendor anticipated.
Both requests had the same answer: expose the platform as infrastructure as well as an app.
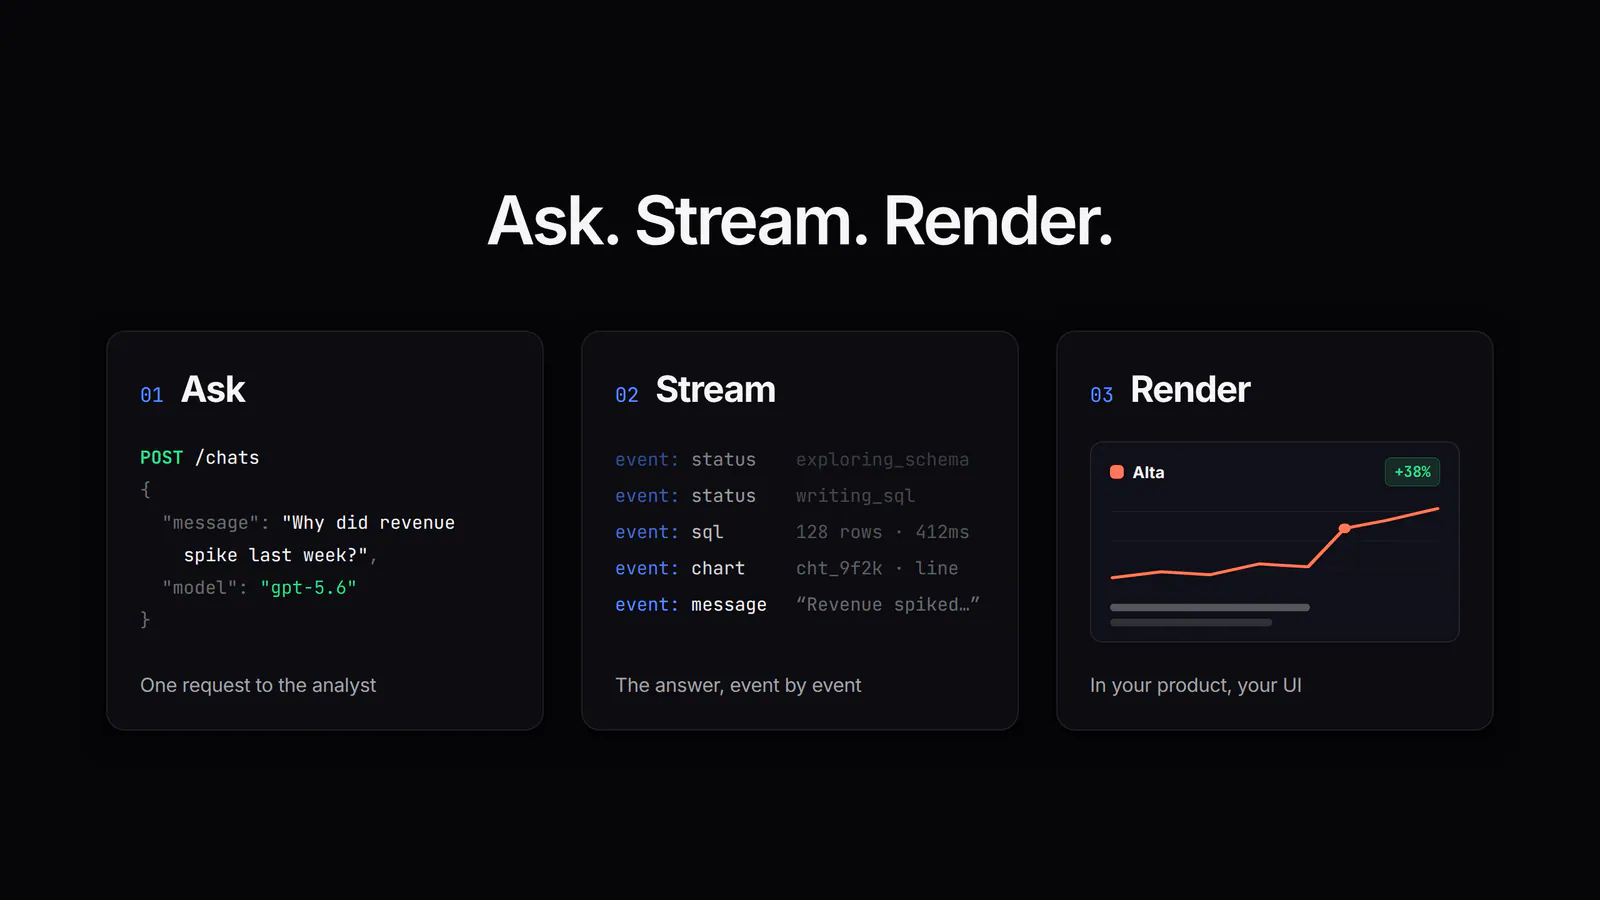
The core loop is three steps.
Ask. POST /chats creates a conversation with the analyst against your connected data sources. Send a message the same way you’d type it into Basedash, for example “Why did revenue spike last week?”
Stream. The analyst’s work streams back as server-sent events: status updates as it explores your schema, the SQL it writes and verifies, the charts it builds, and the final answer. You can render its progress live in your own interface or wait for the completed message. Both are supported, with idempotency keys for safe retries.
Render. The response includes structured chart objects, and every chart has an image endpoint, so you can render results natively in your own components or drop in a generated image anywhere, such as a web app, an email, or a PDF report.
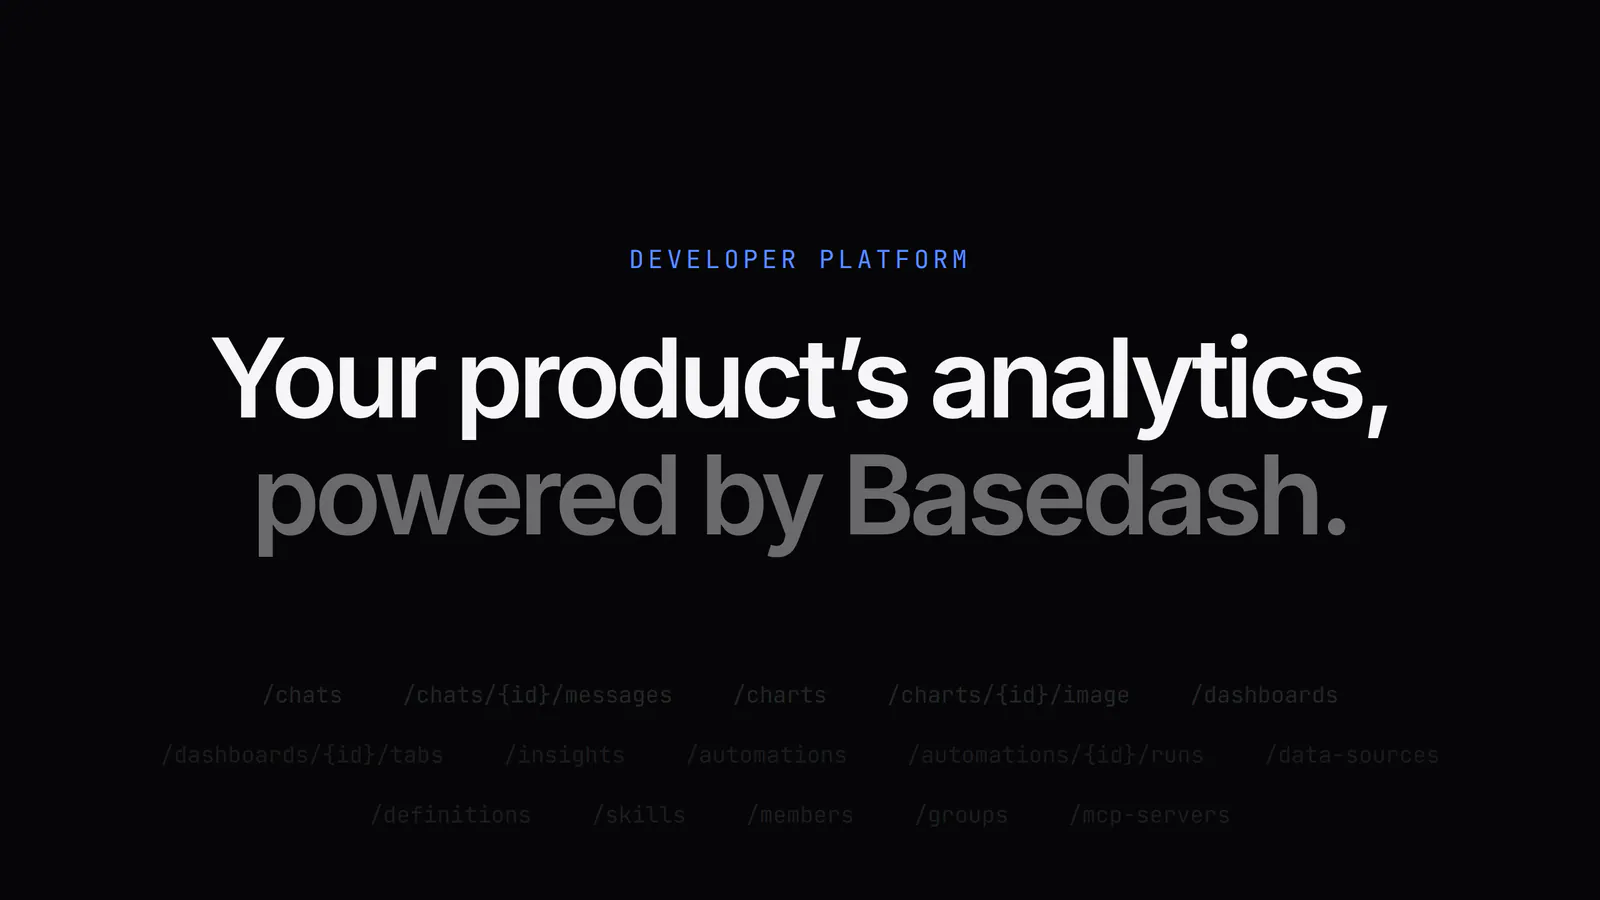
Beyond chat, the API covers the whole platform: charts, dashboards and their tabs, insights, automations and their runs, data sources, metric definitions, skills, members, groups, audit logs, and AI usage.
The main use case is customer-facing analytics in your product, powered by Basedash and presented in your own UI.
We already supported embedding, which lets you drop the Basedash app or a dashboard into your product with an iframe, scoped per customer. That’s still available and still the fastest path. But plenty of teams want analytics that look and feel like their product, with their own design system, components, and interaction patterns. With the developer platform, you build a fully custom UI and Basedash does everything behind it. Your customers ask questions in your interface, and our analyst explores their data, writes and verifies the queries, and hands your frontend the answer and the charts.
Multi-tenancy works the same way it does with embedding: row-level security scopes every query, so customer A can ask anything and never touch customer B’s rows. Scoping is enforced server-side, so your frontend doesn’t have to get it right.
The same API works for internal use. Teams are wiring Basedash into the systems they already run:
When the thing calling Basedash is an agent rather than your code, the Basedash MCP server exposes the same analyst as a tool: connect Claude Code, Cursor, ChatGPT, or an agent you’re building yourself, and it can query your data and get verified answers the same way the API does. The two work well together: the MCP server for conversations, the API for everything you ship.
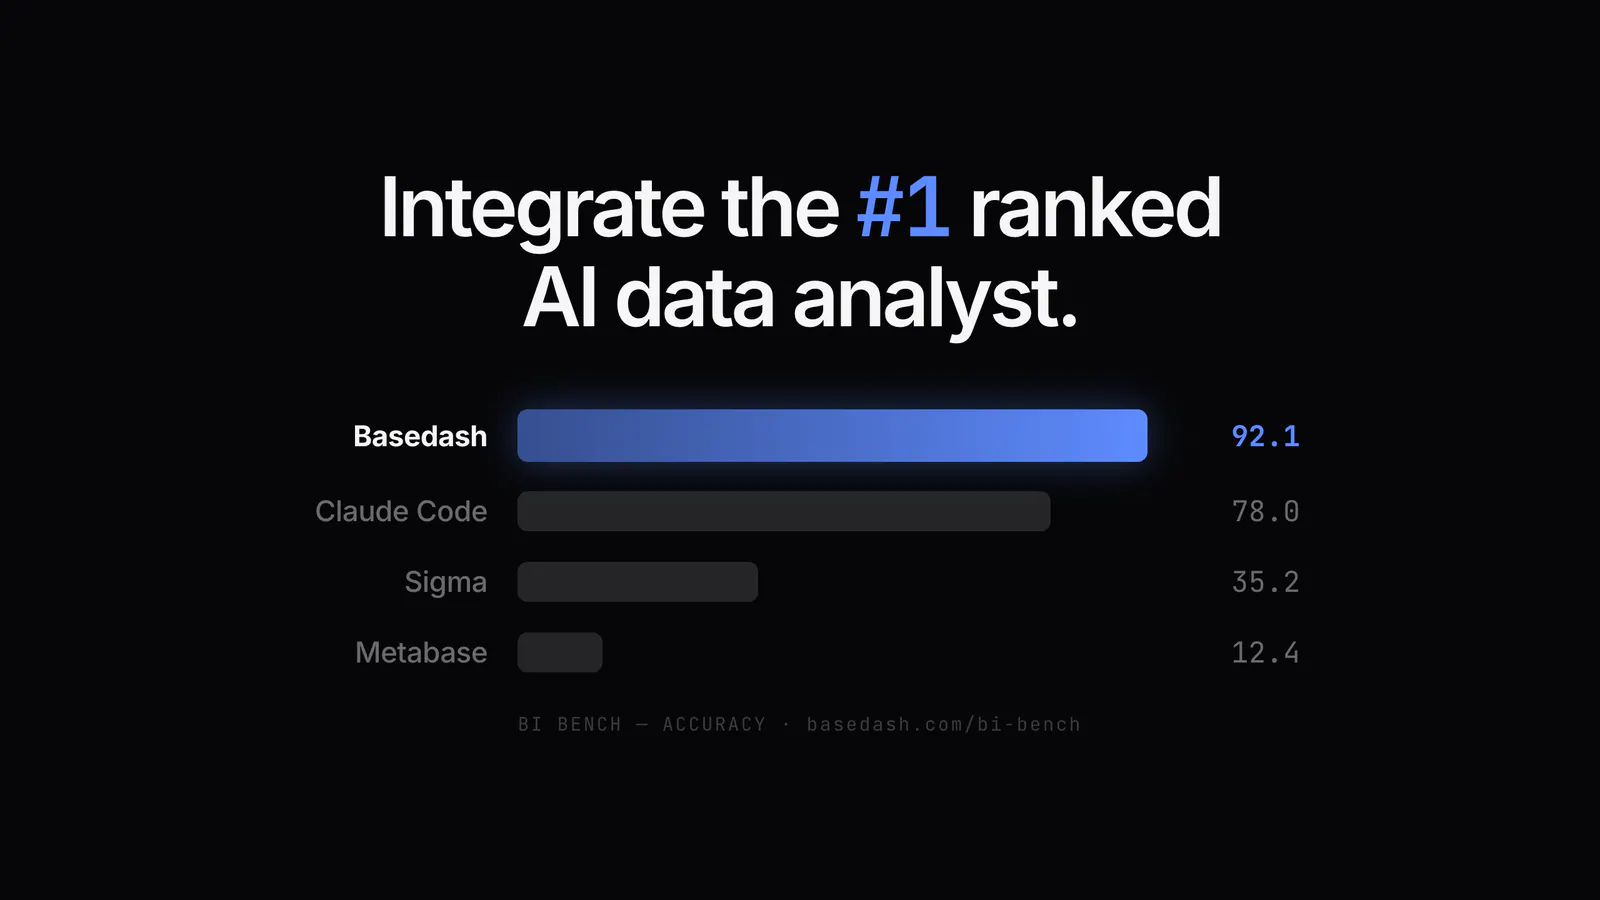
The quality of an analytics API comes down to the analyst behind it. On BI Bench, our public benchmark that runs AI data analyst agents against a real database with a messy schema, Basedash ranks #1 on accuracy, ahead of coding agents like Claude Code and BI platforms like Sigma and Metabase.
Fittingly for a launch on OpenAI day, the analyst runs on GPT-5.6. Every answer is grounded in your schema, validated before execution, and traceable to the queries that produced it, so you can responsibly put it in front of your customers.
The API is available today for all Basedash workspaces.
POST /chats with a question about your dataAuthentication, endpoints, and response formats are covered in the API reference.
Every feature we ship from here lands in the product and the API. Chat, insights, automations, and dashboards were built to answer your team’s questions, and now they can answer your customers’ questions too.
The developer platform is live today for every Basedash workspace.
Written by

Founder and CEO of Basedash
Max Musing is the founder and CEO of Basedash, an AI-native business intelligence platform designed to help teams explore analytics and build dashboards without writing SQL. His work focuses on applying large language models to structured data systems, improving query reliability, and building governed analytics workflows for production environments.
Basedash lets you build charts, dashboards, and reports in seconds using all your data.