Data freshness: how current your dashboard data really is
Data freshness is how up to date your dashboard data is. Staleness adds up across every hop from source to screen. Here is how to measure and fix it fast.

Data freshness is how up to date your dashboard data is. Staleness adds up across every hop from source to screen. Here is how to measure and fix it fast.

How to build dashboards on ClickHouse: how to connect a BI tool, the FINAL gotcha that makes results wrong, materialized views vs raw tables, and when not to.

A report is a static, detailed snapshot for a set period. A dashboard is a live view of key metrics. Here is how the two differ and when to use each one.

Our eval harness compared leaderboard means across 3 trials, which made anything smaller than a 10-point change invisible. Here's how paired statistics and a hierarchical bootstrap turned it into something we can actually gate model switches on.
“Nous avons évalué Omni et d'autres outils BI, mais la rapidité pour obtenir un insight avec Basedash est inégalée.”
Greg Demoge
Co-fondateur et CPO · FullEnrich
Lire l'étude de cas →
“Pour une entreprise aussi soucieuse de sécurité que la nôtre, Basedash a immédiatement fait tilt. Des rapports qui prenaient des semaines sont prêts en quelques heures.”
Claudio Godoy
AI Agents Lead · Taxfyle
Lire l'étude de cas →

Snowflake acquired Sisu Data and discontinued its standalone product. Learn what happened to the decision-intelligence platform and which alternatives fit its workflows.

Decision intelligence is the discipline of connecting data to the decisions and actions it should drive. Here is a plain definition and a working framework.

A weekly business review is a short recurring meeting where a team reviews its core metrics against plan to catch changes early. Here is how to run one.

A practical guide to slowly changing dimensions: the SCD types, a decision framework for choosing one, SQL and dbt patterns, and point-in-time reporting.

The managed Redash service shut down in 2021, while open-source Redash continues. Learn the difference and the best cloud and self-hosted alternatives.

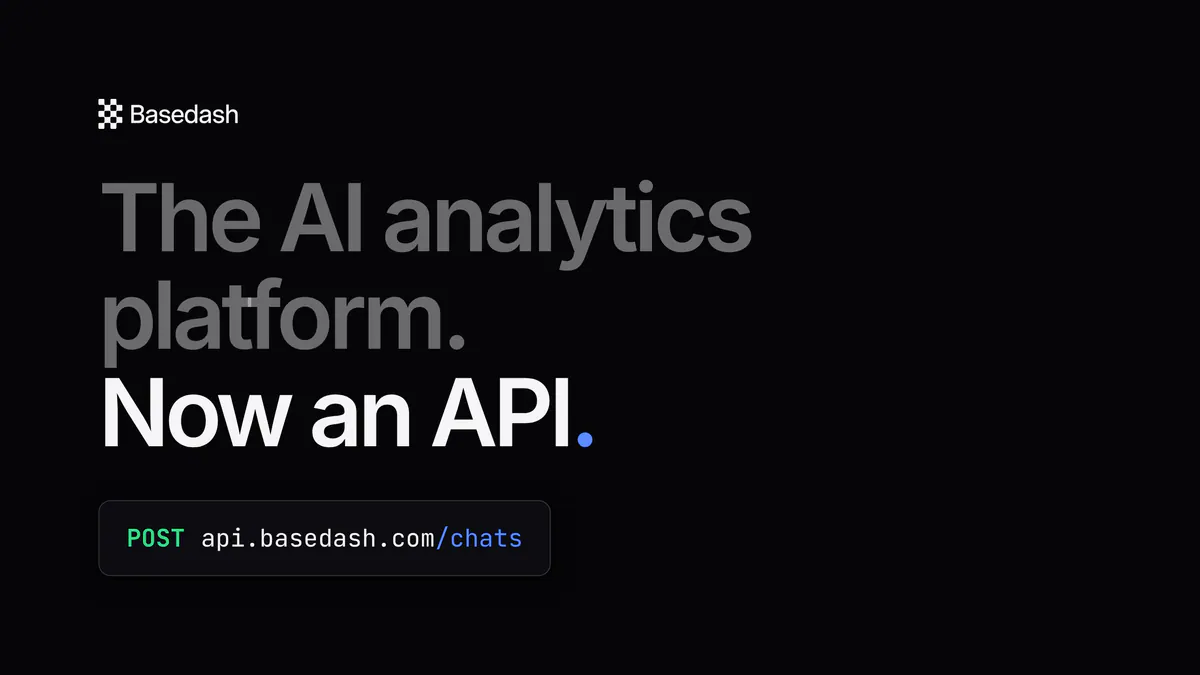
Everything Basedash does — AI data analyst chat, automatic daily insights, automations, dashboards — is now available through the API. Power your product's customer-facing analytics with a fully custom UI, or extend your internal BI in custom ways, all built on the AI data analyst ranked #1 on BI Bench.

Analytics engineering turns raw warehouse data into clean, tested, documented models BI tools can trust. Learn what the role does and when you need it.

How to build real reporting dashboards on your Supabase data: connection options, read replicas, the row-level security gotcha, and which BI tools fit.

A practical analytics maturity model for lean teams: the 5 stages, how to diagnose which one you're in, and the single move that gets you to the next.

Chartio shut down after Atlassian acquired it. Learn what happened to the visual SQL BI platform and which modern alternatives can replace its dashboards.

Our chat agent was running 140 introspection queries per benchmark run against customer warehouses just to find the right tables. Here's how we built a schema catalog with search tools and bounded data profiling, and cut that to 2.

A data contract is an agreement on a dataset's schema, semantics, and quality. Learn what one includes, why dashboards break without them, and when to use them.