Introducing the Basedash Connector gallery
Max Musing
 Max MusingFounder and CEO of Basedash
· October 15, 2026
Max MusingFounder and CEO of Basedash
· October 15, 2026
Max Musing
Max MusingFounder and CEO of Basedash
· October 15, 2026
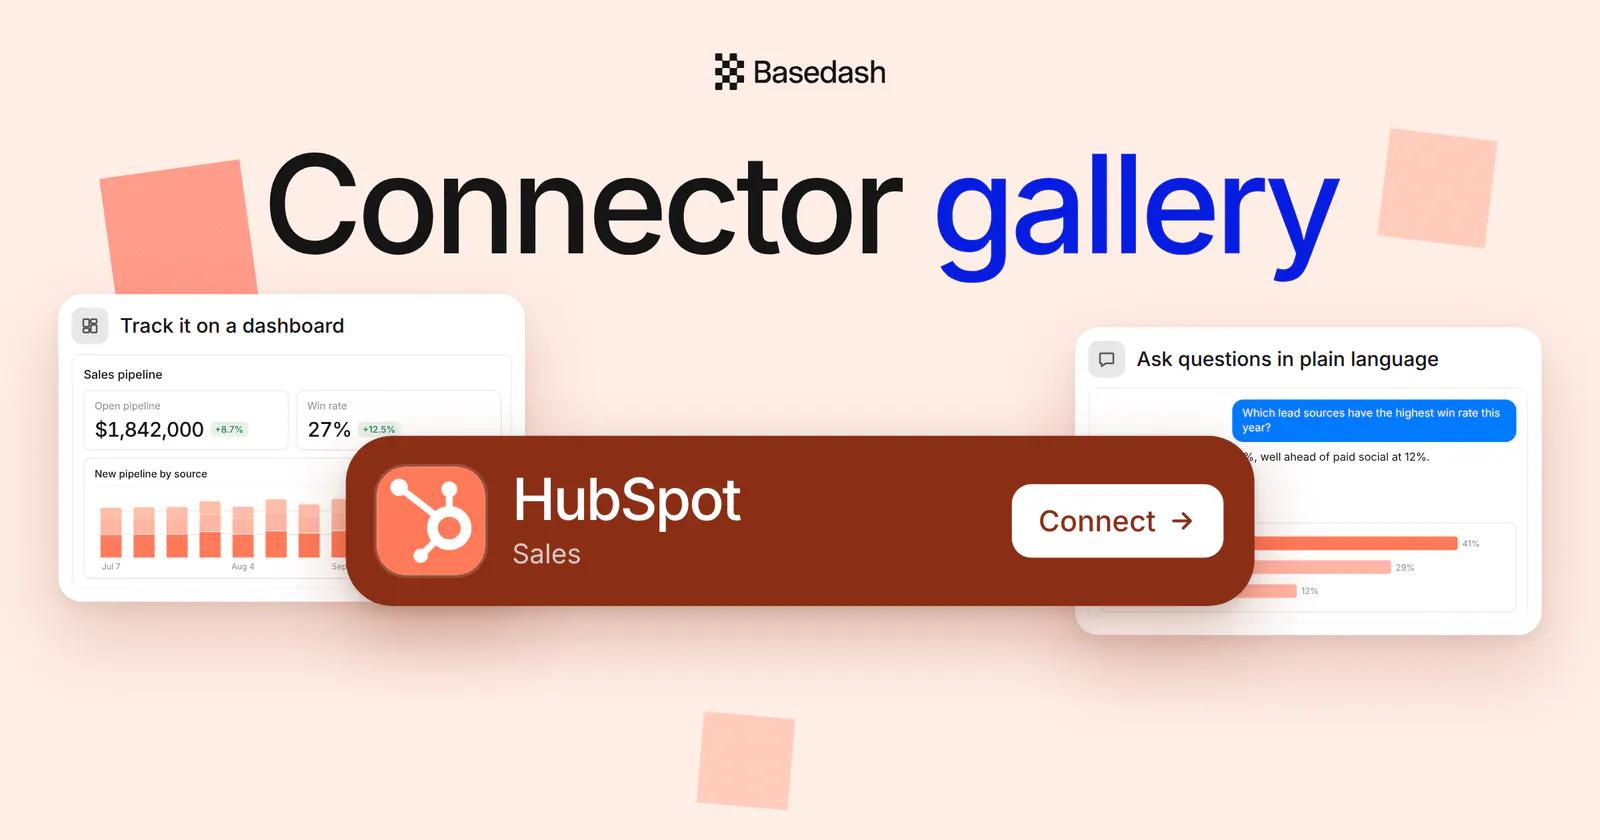
Today we’re launching the Basedash Connector gallery. Every data source in Basedash now has its own home page that shows what you’ll build with it before you connect: a live dashboard, a question asked in plain language, a Slack alert, and a join with another source, all on example data.
Picking a connector used to land you on a logo, a paragraph, and a Connect button, and you had to hope the setup would be worth it. Now each one opens like an app store page, so you know what you’re getting before you hand over any credentials.
See what you’ll build before you connect.
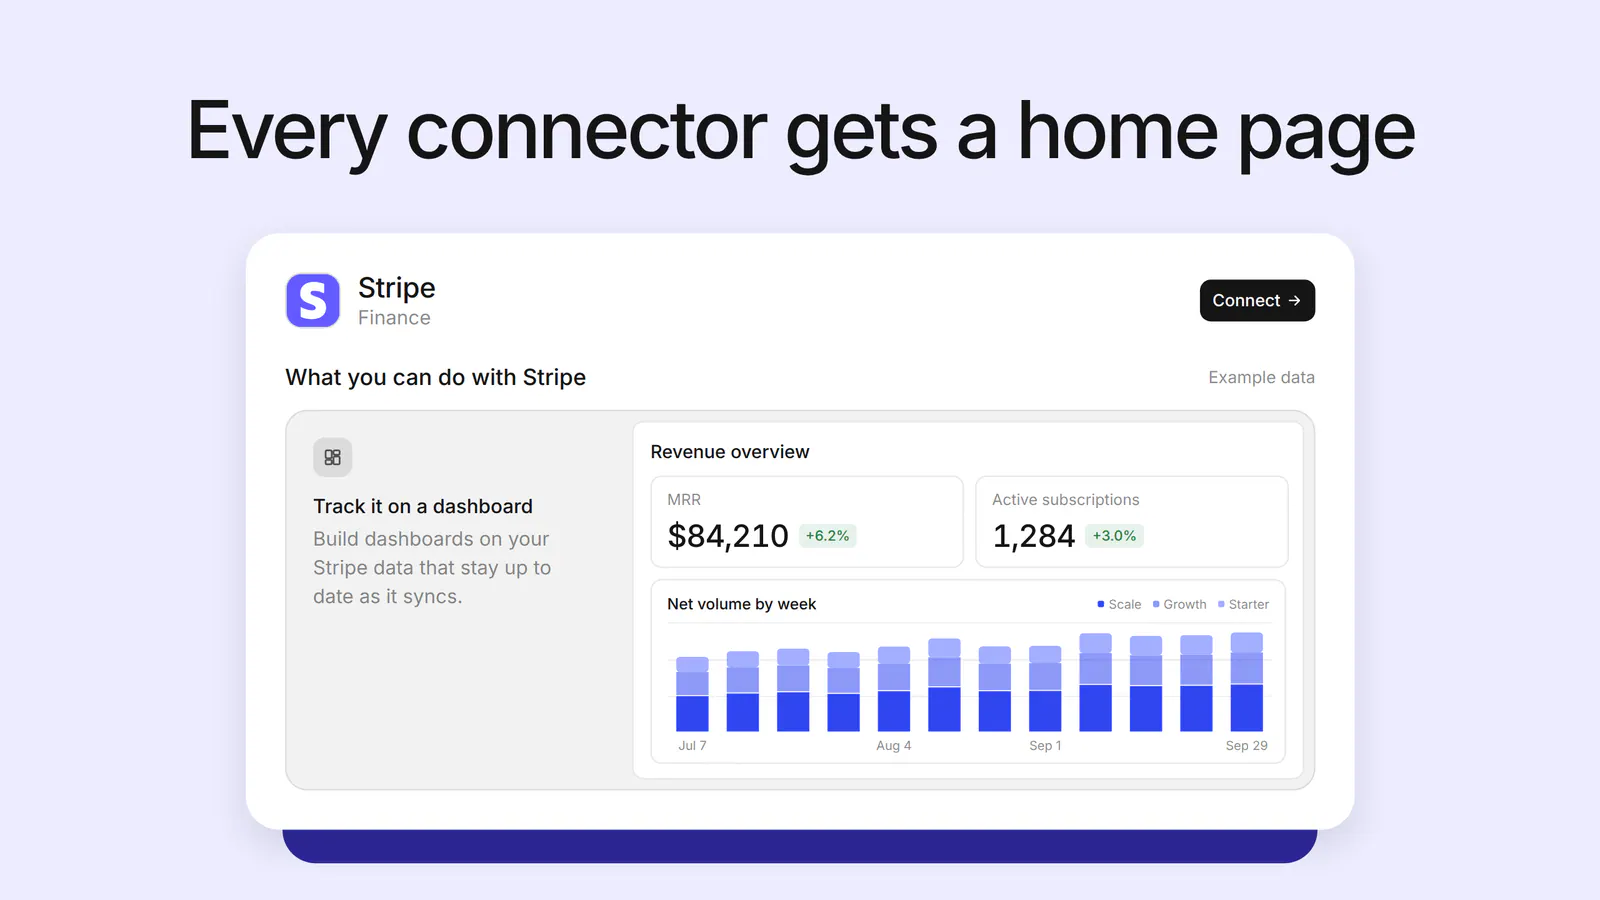
Open Data, then Add data source, and pick any connector. Its home page leads with the basics: the logo, the name, and the category, one Connect button, and a link to the connector’s documentation.
Below that is “What you can do with Stripe” (or HubSpot, or Shopify), a set of previews labeled as example data. They’re rendered by the same chart engine you’ll use once you connect, so what you see is what you’ll get.

Every connector page has the same four previews, each tailored to that source. For HubSpot, they look like this:
Stripe, Shopify, GitHub, Google Sheets, and the rest each get their own versions, with metrics and questions that make sense for that data.
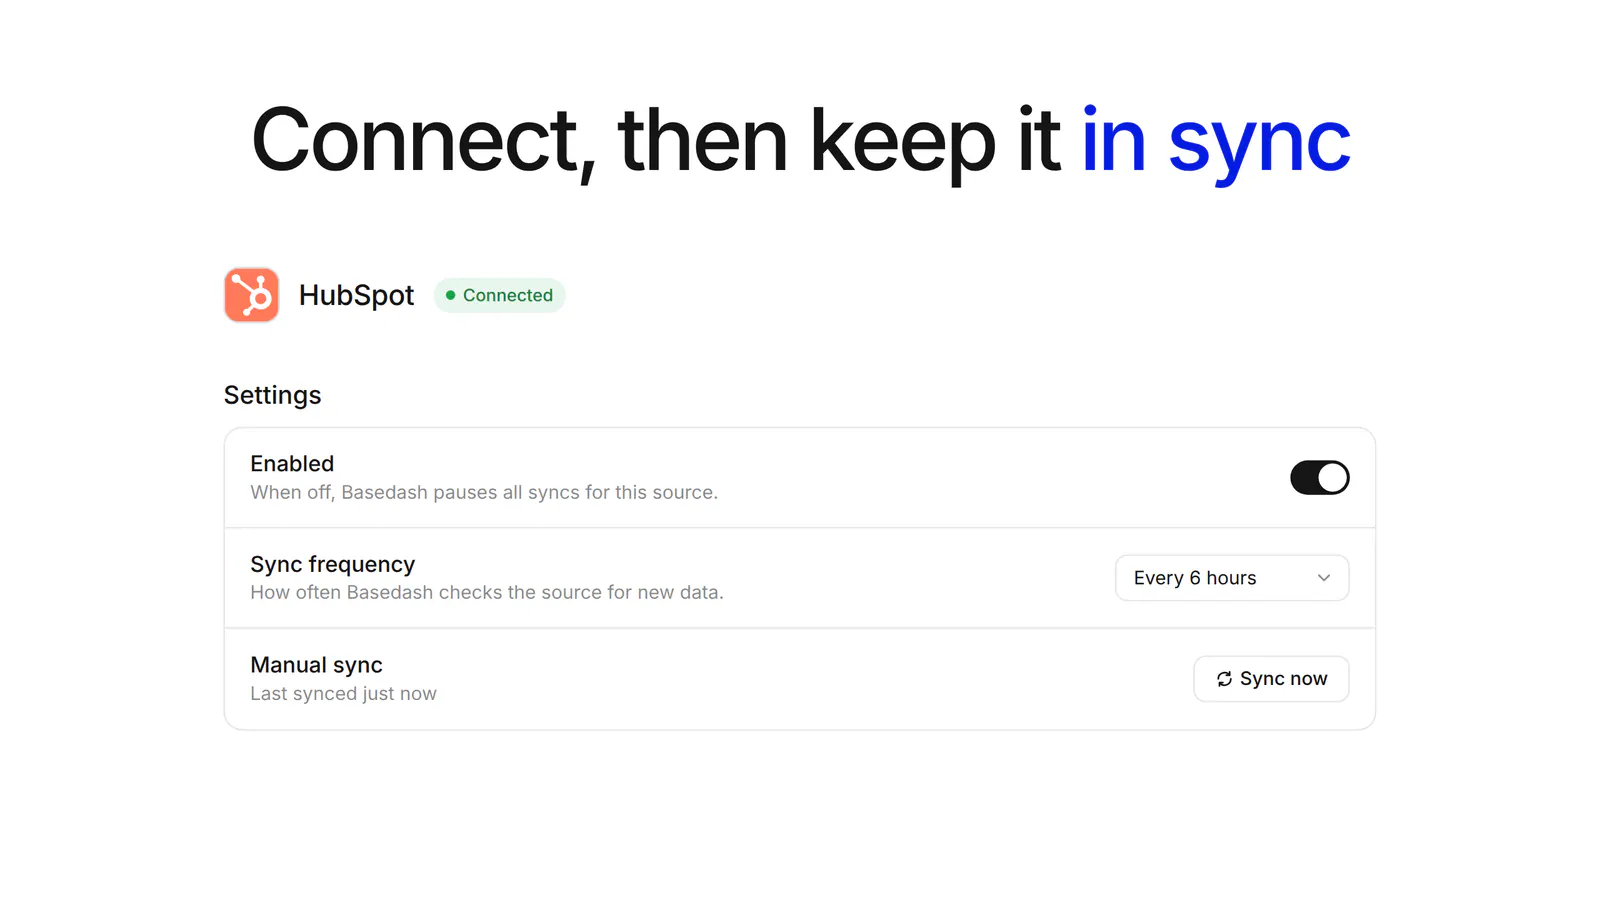
When it looks right, click Connect. Once the source is connected, the same page becomes its home for sync settings:
The previews, the docs, the Connect button, and the sync settings all live on one page per connector.
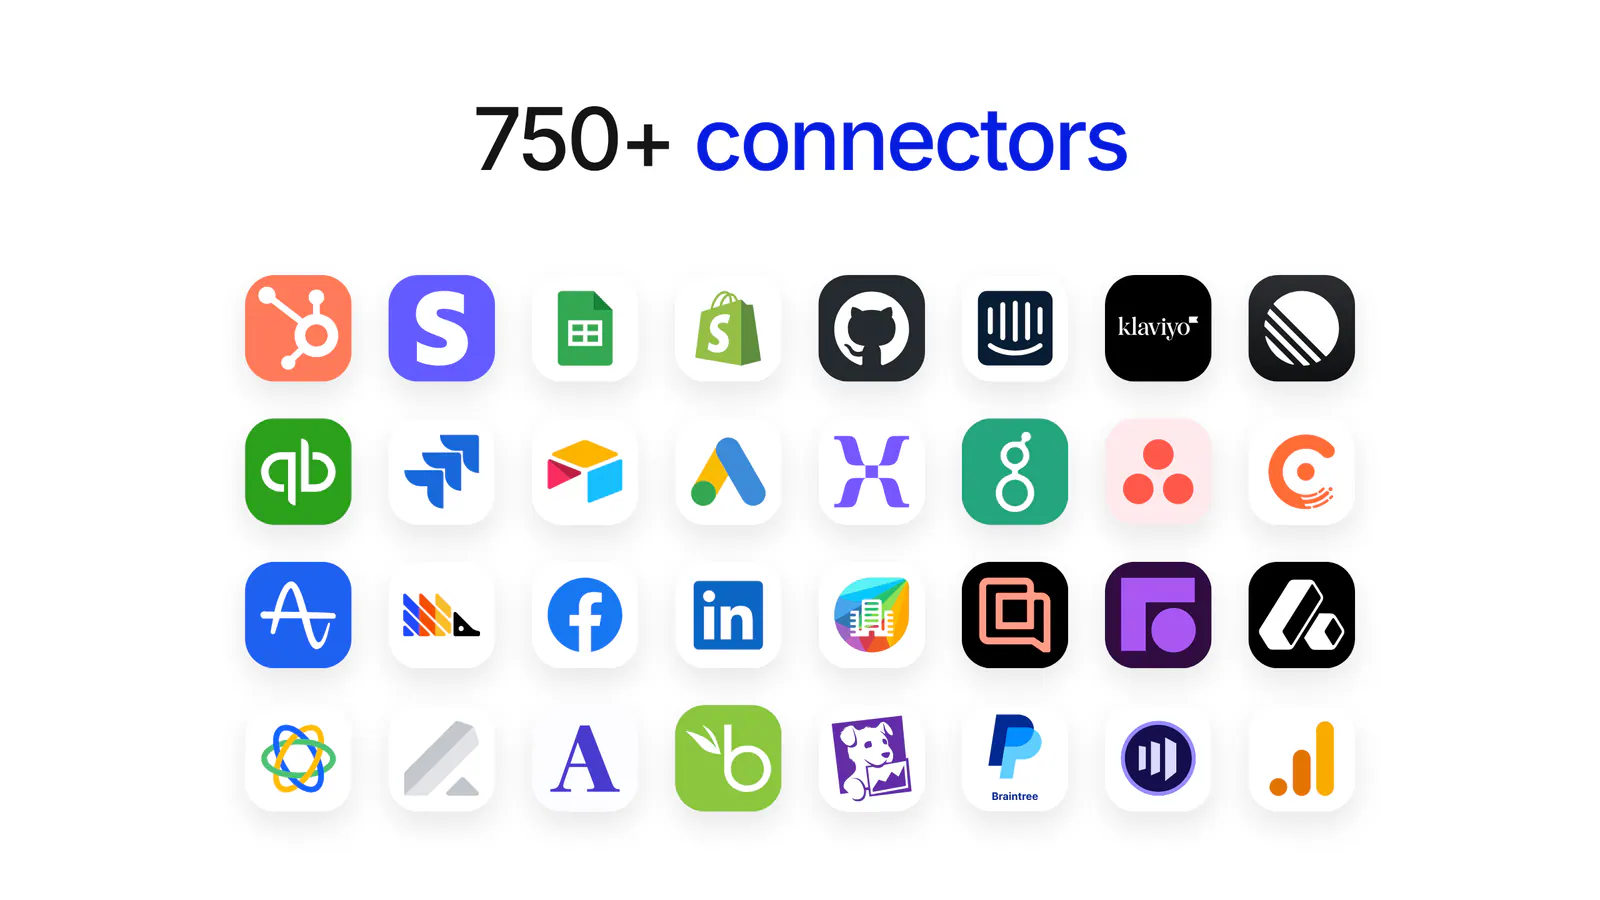
The gallery covers all 750+ connectors in Basedash, from CRMs and billing tools to ad platforms, support desks, and spreadsheets. Each one gets its own home page.
You can browse the full list on our data sources page, and read more about how data gets into Basedash on the data ingestion feature page.
The Connector gallery is in Basedash today.
See what you’ll build before you connect.
Written by

Founder and CEO of Basedash
Max Musing is the founder and CEO of Basedash, an AI-native business intelligence platform designed to help teams explore analytics and build dashboards without writing SQL. His work focuses on applying large language models to structured data systems, improving query reliability, and building governed analytics workflows for production environments.
Basedash lets you build charts, dashboards, and reports in seconds using all your data.