Chat builds whole dashboards, live in the conversation
Max Musing
 Max MusingFounder and CEO of Basedash
· October 1, 2026
Max MusingFounder and CEO of Basedash
· October 1, 2026
Max Musing
Max MusingFounder and CEO of Basedash
· October 1, 2026
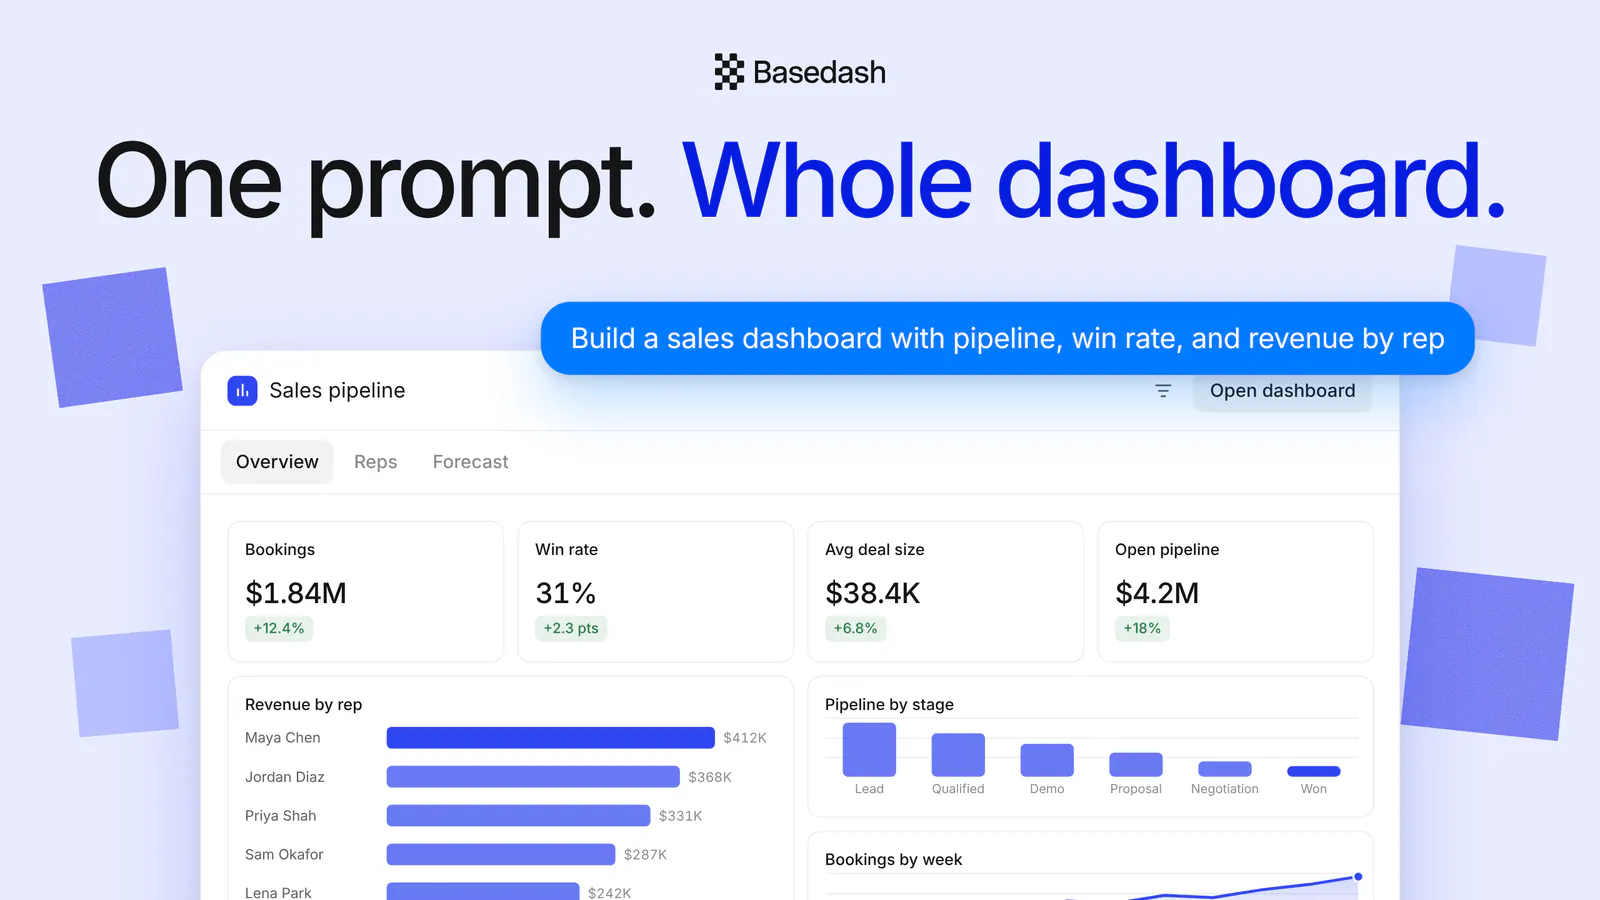
Today we’re launching live dashboard previews in Basedash chat. Ask chat for a dashboard and it builds the whole thing, then shows it to you right in the conversation: KPIs, charts, tables, filters, and tabs, all interactive, before you ever leave the thread.
The Dashboard Agent already builds whole dashboards from a prompt, starting from a new dashboard. But chat is where most questions start, and the question behind a dashboard is rarely a single chart. It’s a dozen related metrics, a couple of breakdowns, and the filters people actually reach for. Now you can ask for all of it in the conversation you’re already having, and see the result there.
One prompt. A whole dashboard, live in your chat.
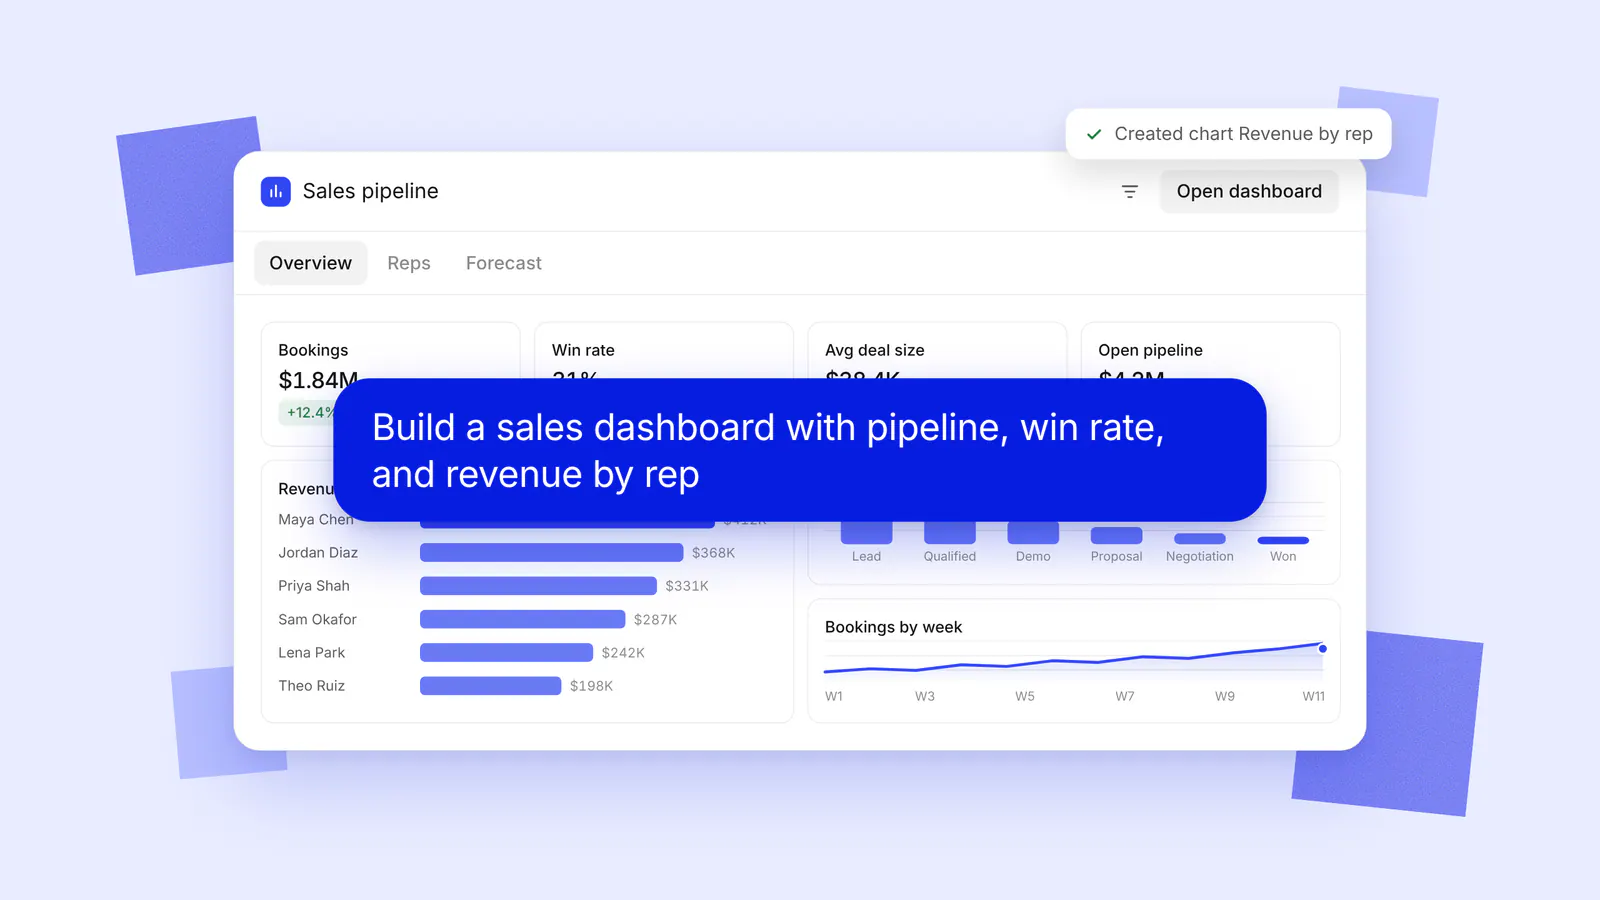
Describe the dashboard the way you’d describe it to a teammate: “Build a sales dashboard with pipeline, win rate, and revenue by rep.”
Basedash takes it from there. You can follow along as it works, with each step showing up in the conversation as it happens (“Created chart Revenue by rep”, “Created filter Region”), until the row collapses to a short summary like “Analyzed for 24s.” What comes back is a complete dashboard: headline KPIs across the top, the charts underneath, a table where a table makes more sense, filters, and tabs to keep related views together.
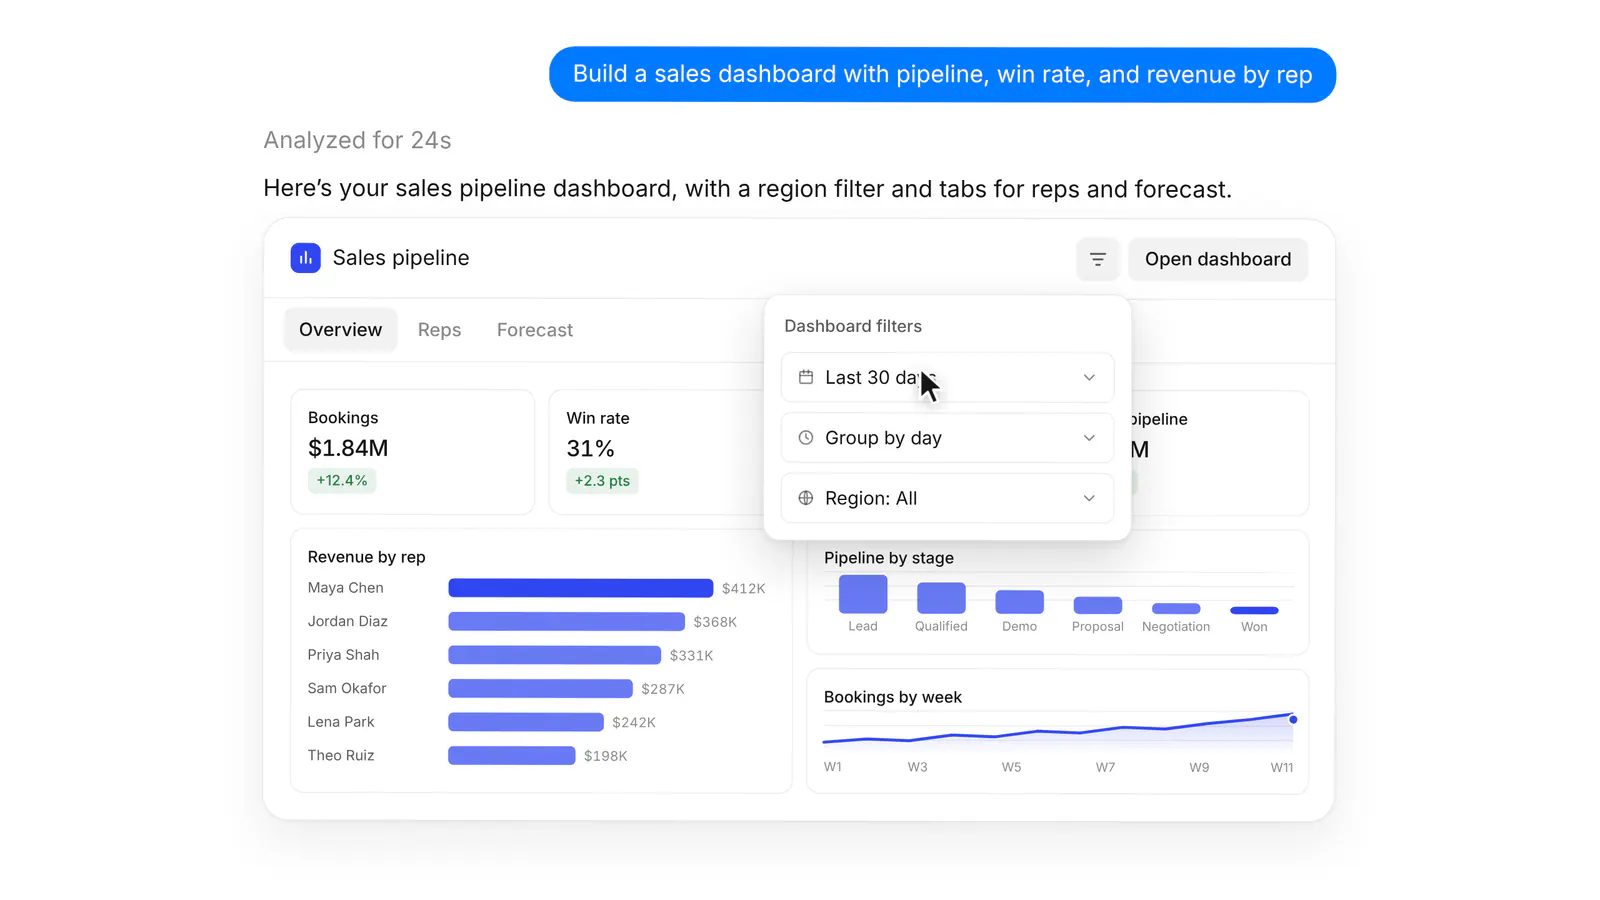
The preview renders the actual dashboard grid, scaled to fit the width of the chat, with the dashboard’s name and an Open dashboard button in its header.
Open the filter menu and you get the same dashboard filters you’d use on the full page: the date range, how to group by time, and any variables the dashboard defines, like region. Change “Last 30 days” to “Last 7 days” and every chart in the preview updates.
Those changes stay in the preview. Trying a different date range in chat doesn’t change the saved dashboard for anyone else, so you can poke at it freely while you decide whether it’s what you wanted.
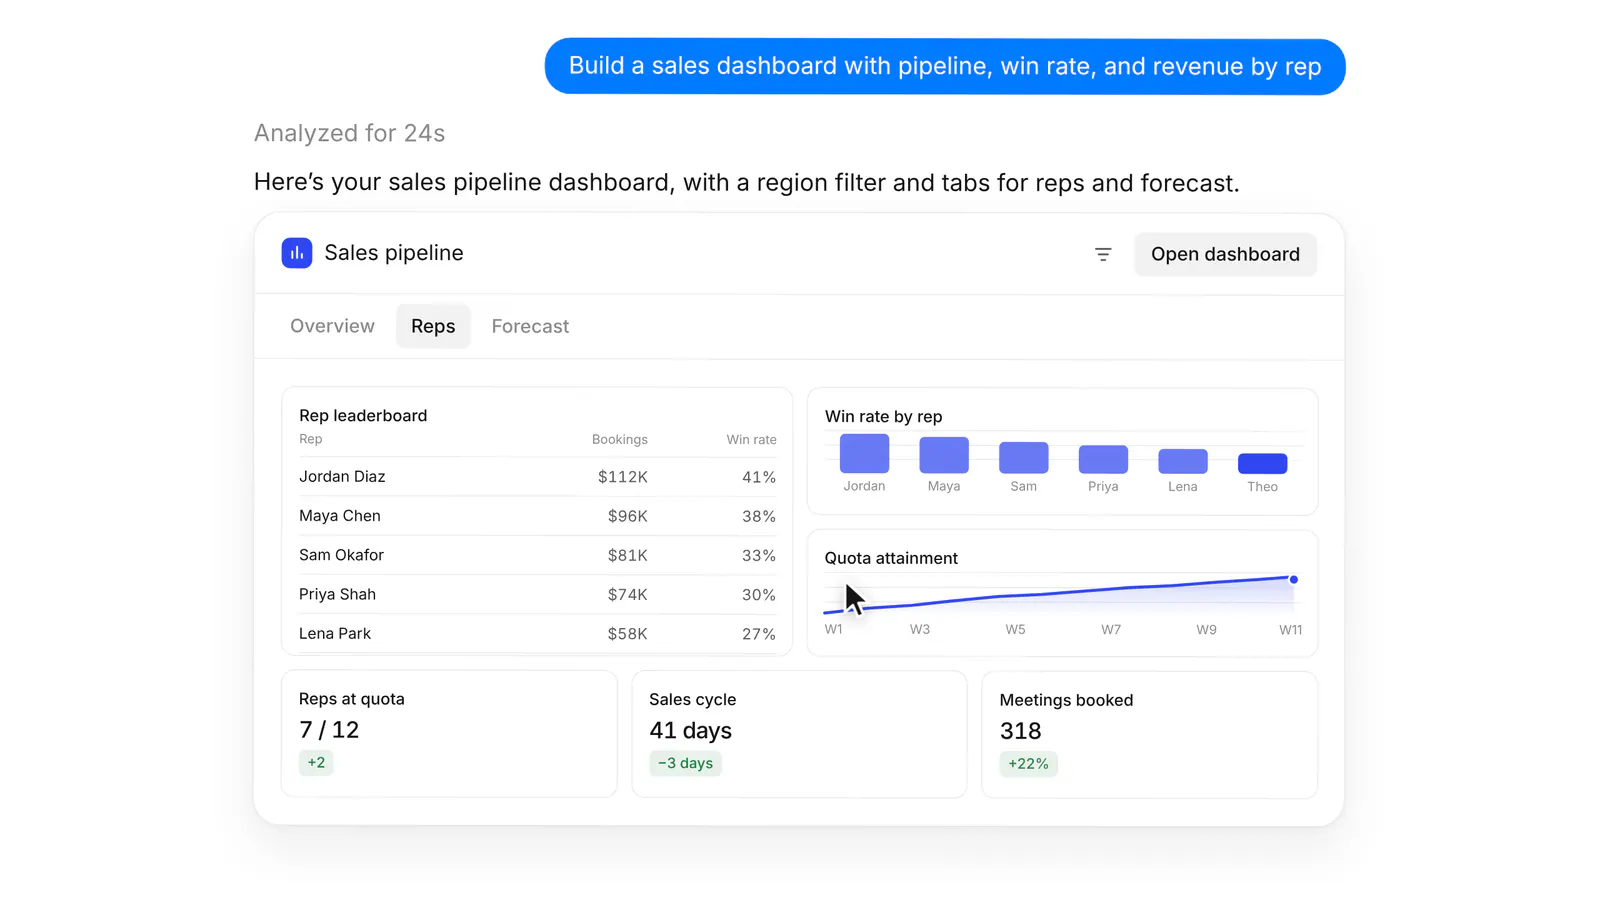
When a dashboard has more than one tab, the tab row shows up in the preview too. In the sales example, the Overview tab holds the headline numbers, while Reps holds a leaderboard table, win rate by rep, quota attainment, and a few more KPIs. Click a tab and the preview switches to it, right there in the conversation.
The preview shows the first three rows of the dashboard and fades out below that, so a long dashboard stays readable in the thread. The side panel keeps things tighter still and collapses the preview to a single row with the dashboard’s name and a button to open it.
When it looks right, hover the preview and click Open dashboard. You land on the full page with every row, every tab, and every chart, ready to share with your team.
Nothing gets copied or exported along the way. The preview was rendering the real dashboard the whole time, so opening it just takes you to the same thing at full size.
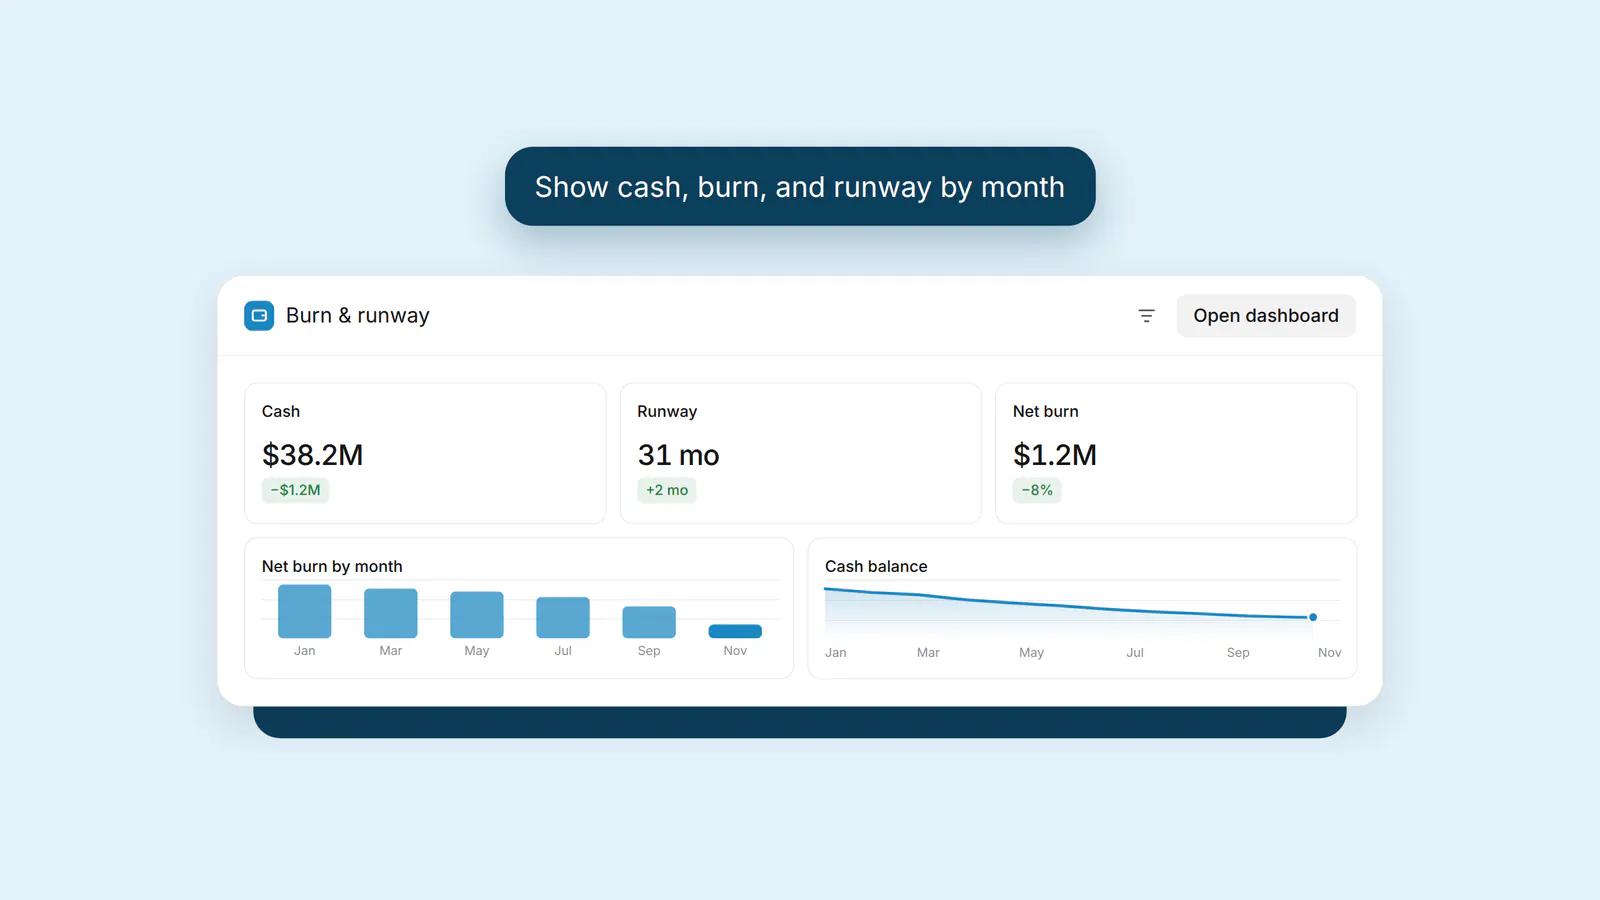
Sales, support, product, finance, and ops can all start the same way. A few prompts to try:
Each one comes back as a full dashboard in the conversation, built from the data sources you’ve connected.
Live dashboard previews are in Basedash chat today.
For more on how dashboards work in Basedash, see the dashboards feature page.
One prompt. A whole dashboard, live in your chat.
Written by

Founder and CEO of Basedash
Max Musing is the founder and CEO of Basedash, an AI-native business intelligence platform designed to help teams explore analytics and build dashboards without writing SQL. His work focuses on applying large language models to structured data systems, improving query reliability, and building governed analytics workflows for production environments.
Basedash lets you build charts, dashboards, and reports in seconds using all your data.