Introducing Basedash MCP write: build charts from anywhere
Max Musing
 Max MusingFounder and CEO of Basedash
· September 25, 2026
Max MusingFounder and CEO of Basedash
· September 25, 2026
Max Musing
Max MusingFounder and CEO of Basedash
· September 25, 2026
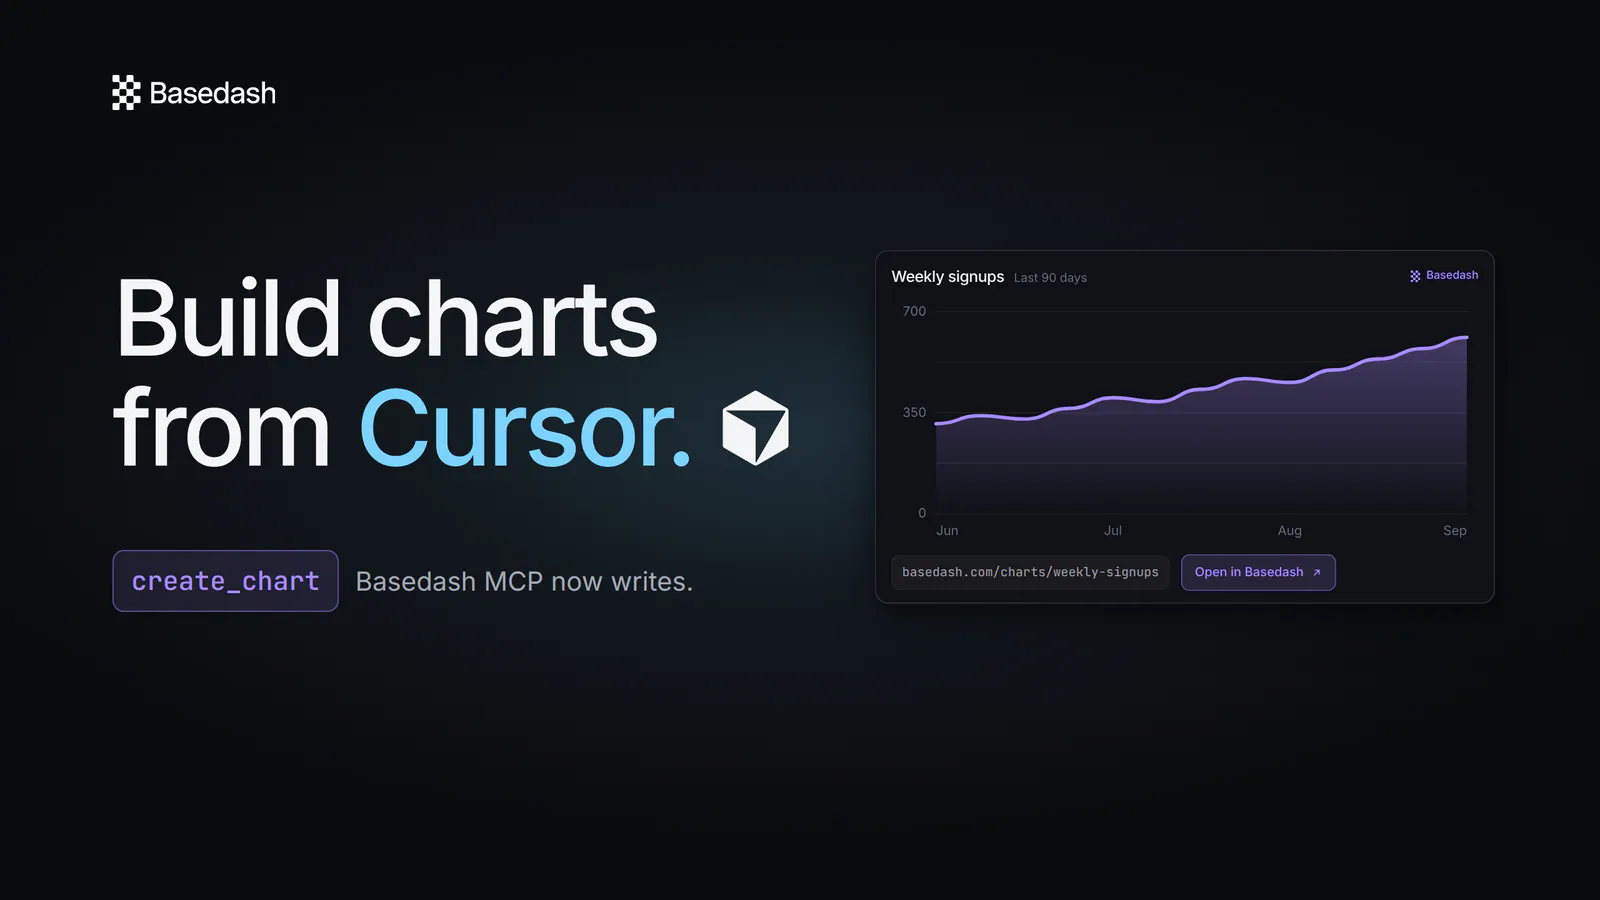
Today we’re launching write access for the Basedash MCP server. Your coding agent can now create and edit charts and dashboards in Basedash — not just read data.
Until now, connecting Basedash to Cursor or Claude meant your agent could ask questions about your data. Now it can build with it. Say “chart weekly signups, last 90 days” and a real Basedash chart comes back in the thread, with a link and a rendered image. Say “break it out by plan” and it updates. Say “build a growth dashboard” and you get a laid-out, validated dashboard in one call.
Not just read. Write.
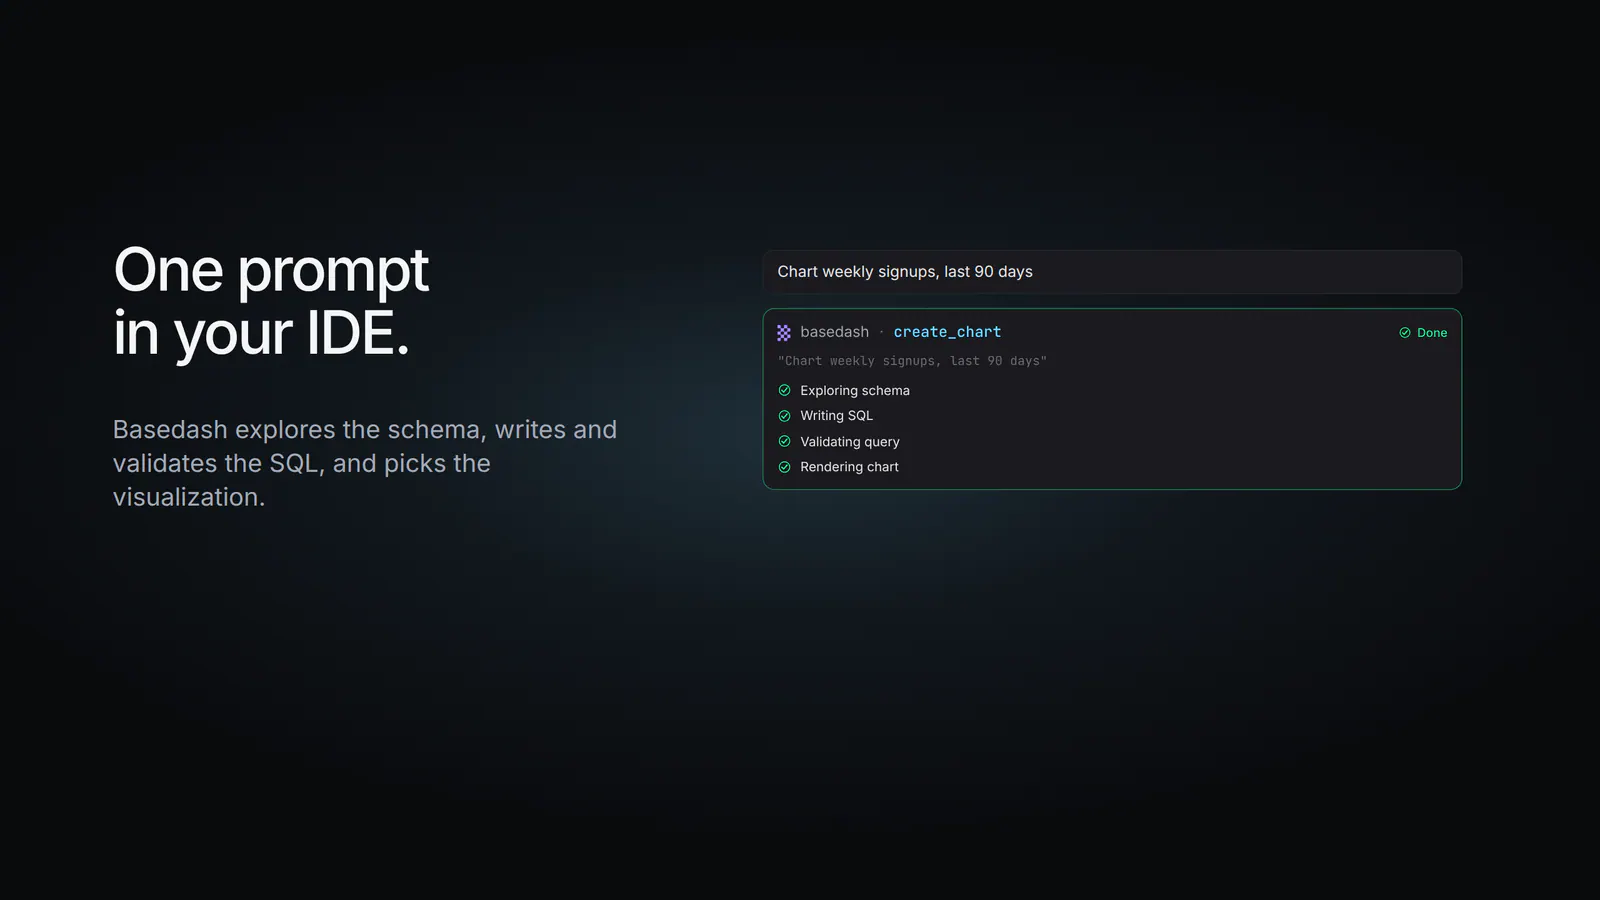
You describe the chart. Basedash does the rest. Behind a single create_chart call, Basedash explores your schema, writes the SQL, validates the query against your data, and picks the visualization — so the agent never has to guess at your table names or hand-roll a query it can’t check.
The tool call reads like a checklist in your client: exploring schema, writing SQL, validating query, rendering chart. When it’s done, the chart is done.
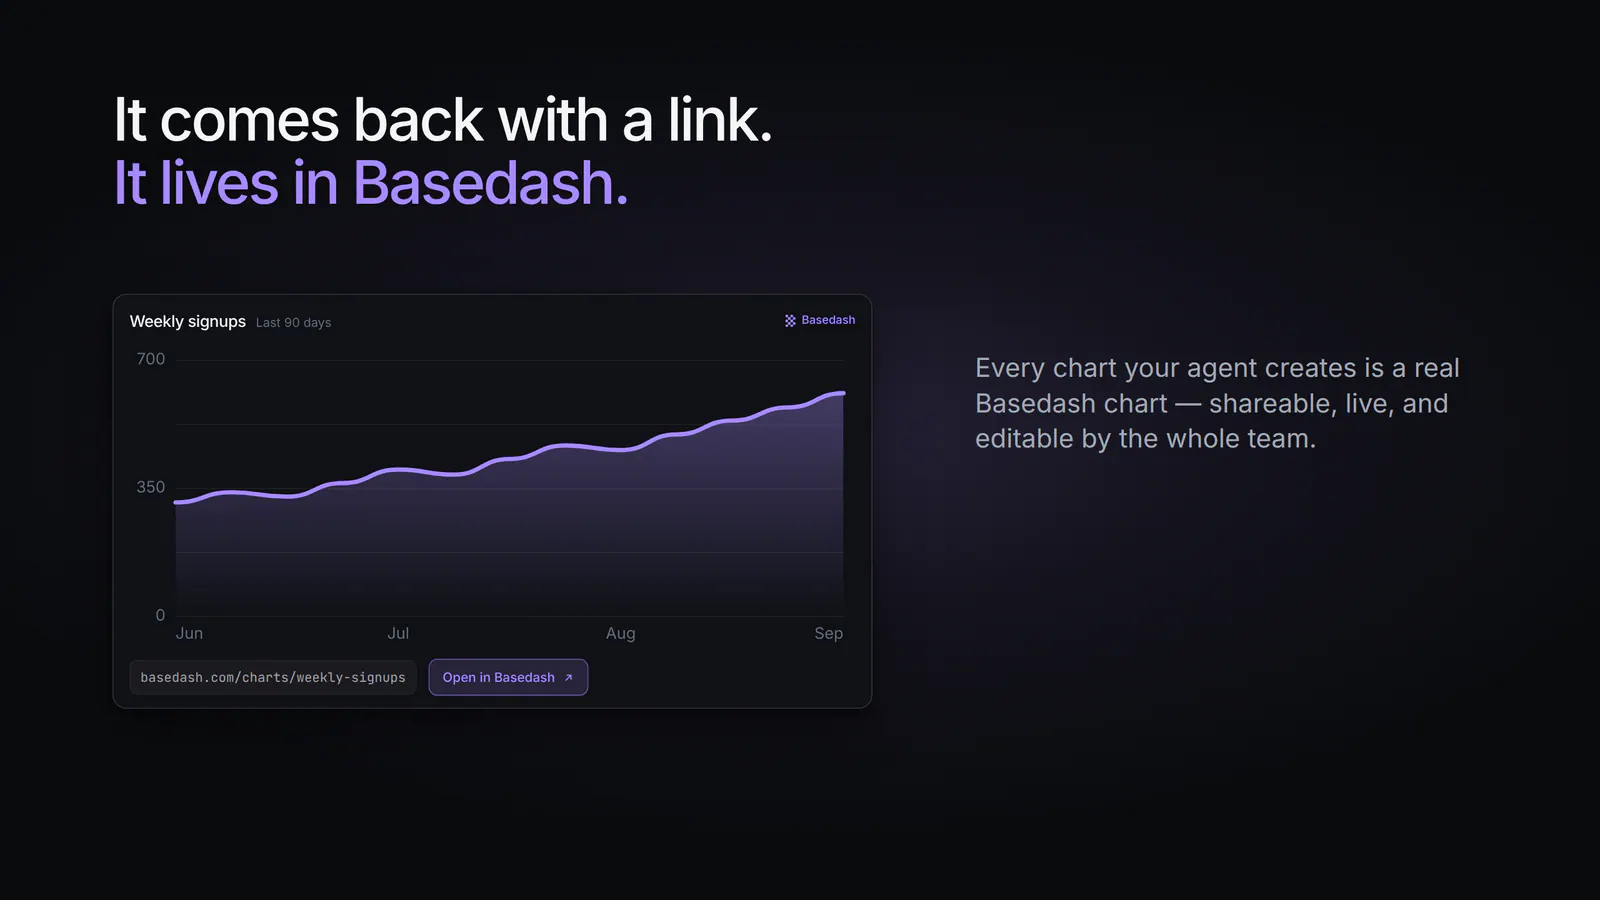
The result isn’t a one-off image pasted into a chat. Every chart and dashboard your agent creates is a real Basedash artifact with a durable URL, and the tool returns that link along with a rendered screenshot so you can see it without leaving the IDE.
Open the link and you’re looking at the same chart on its Basedash page — validated SQL, live data, and everything the rest of your team already uses to find, share, and refine work. You keep iterating where you are. The artifact lives where the team can find it.
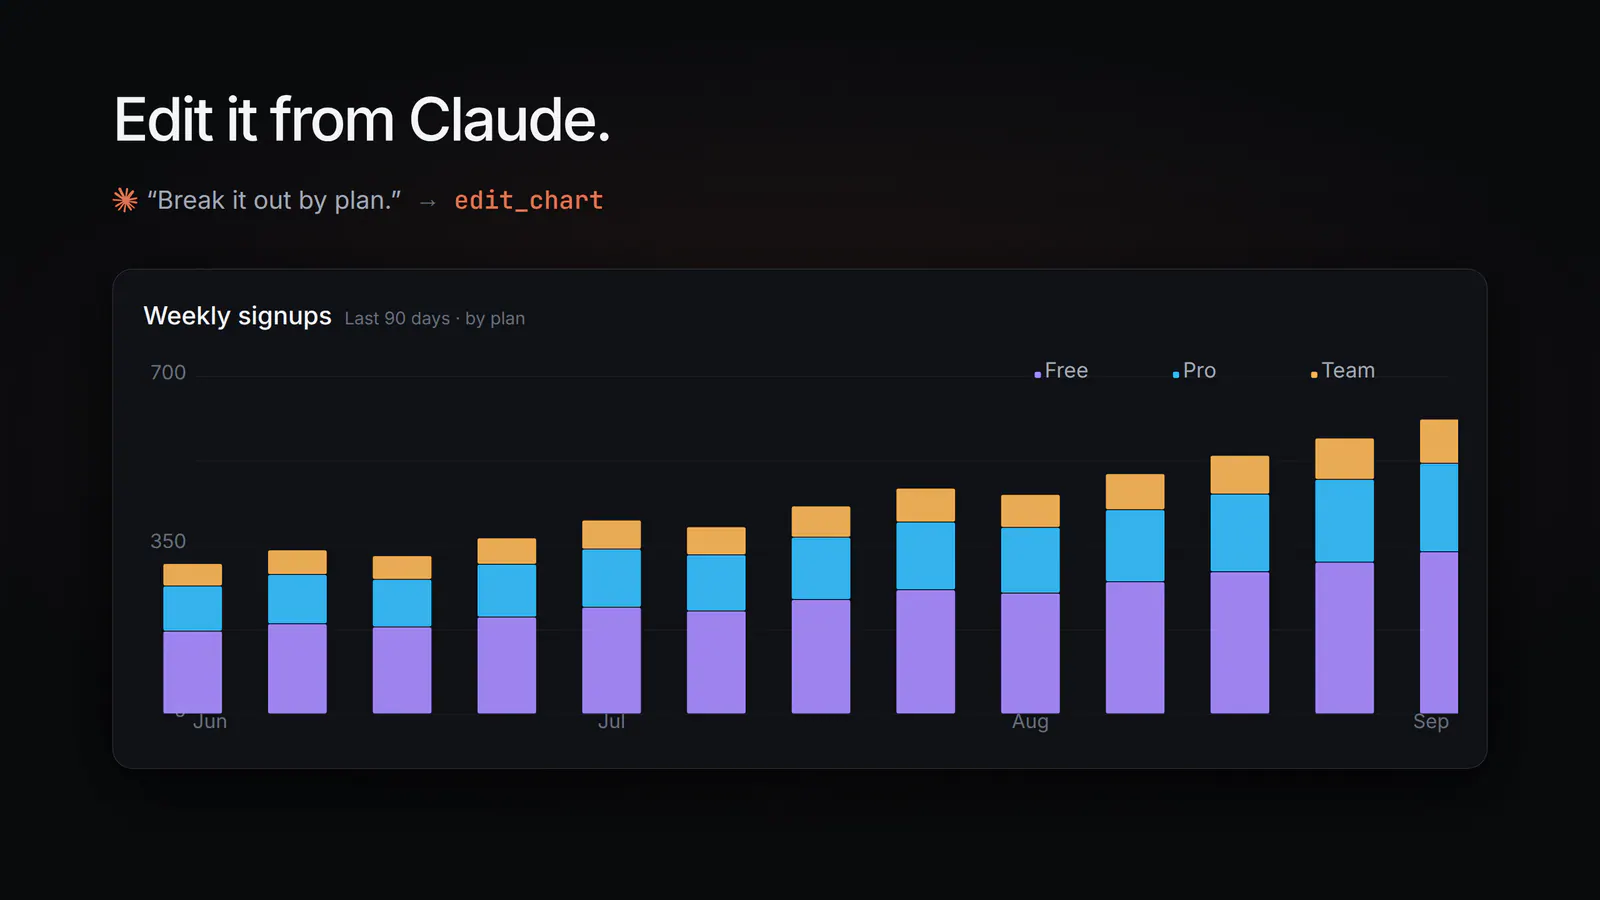
Editing works the same way as creating. Follow up with “break it out by plan” and edit_chart revises the live chart: the weekly signups line becomes stacked bars for Free, Pro, and Team. Rename it, change the time range, swap the visualization, add a filter — all in plain language, all against the real chart, not a copy.
Because the chart stays in Basedash, the edit is visible to everyone who has the link, immediately. No re-exporting, no stale screenshot in a doc.
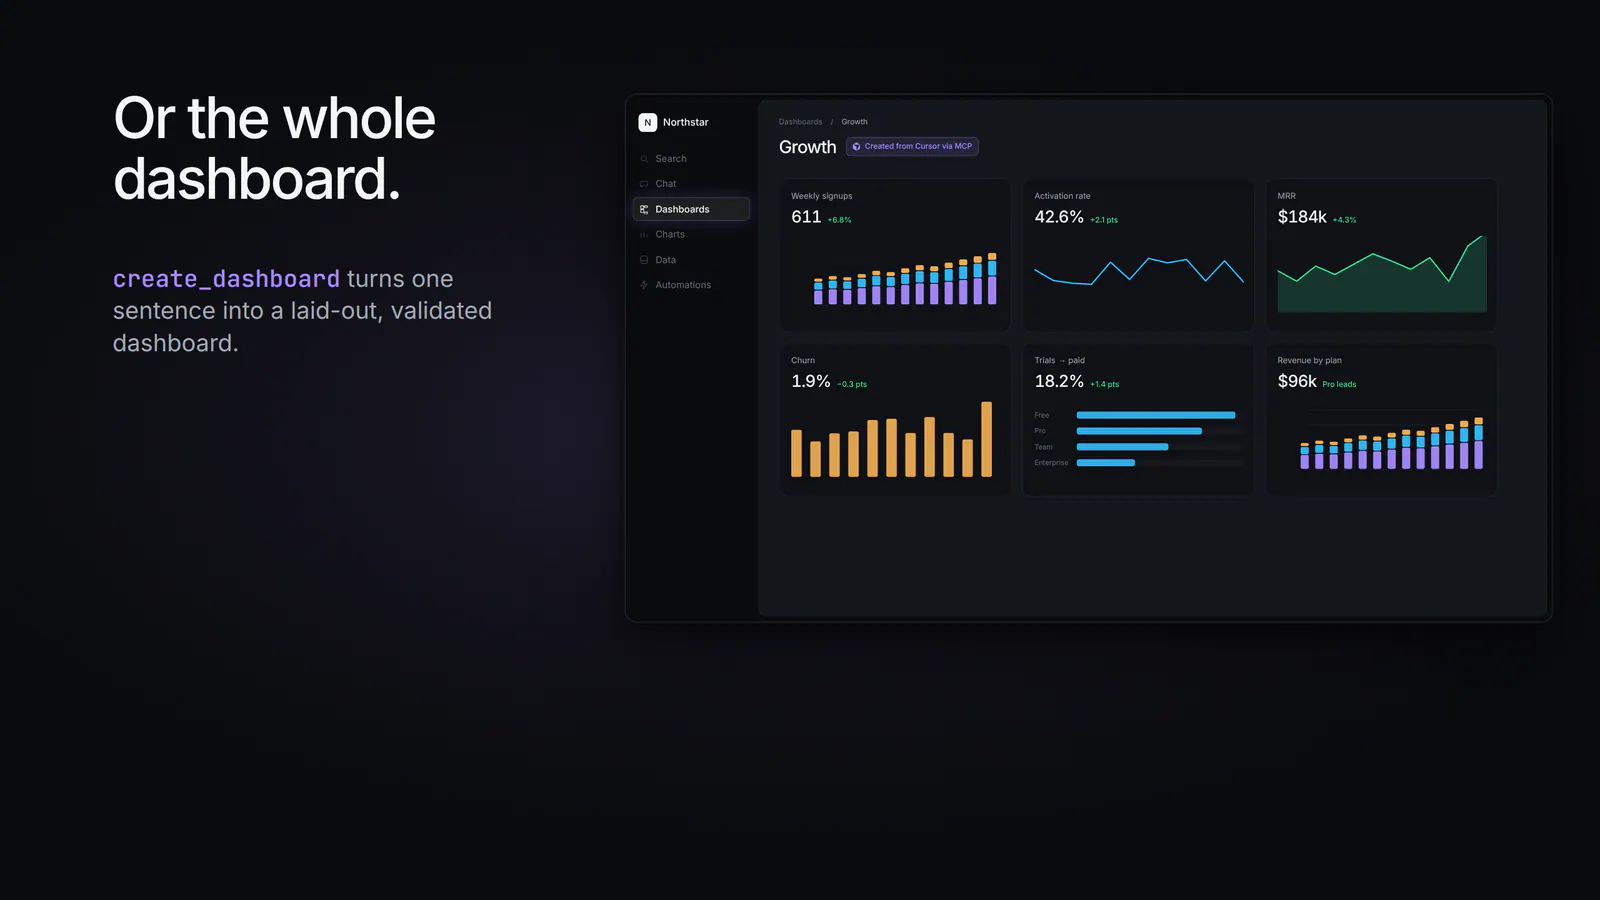
create_dashboard turns one sentence into a laid-out, validated dashboard. Ask for “a growth dashboard: signups, activation, revenue, churn” and Basedash builds each chart, checks every query, and arranges the result — then hands back the dashboard link.
edit_dashboard handles the follow-ups, and create_chart can drop a new chart straight onto an existing dashboard when you point it at one.
The write surface is deliberately small:
create_chart — create a chart from a natural-language instruction, optionally placing it on a dashboard.edit_chart — update an existing chart.create_dashboard — build a dashboard from a description.edit_dashboard — update an existing dashboard.They join ask_question and get_data_sources, plus a set of read tools — list_dashboards, get_dashboard, list_charts, get_chart — so the agent can find the work your workspace already relies on before creating something new. Every dashboard and chart tool returns a durable Basedash URL, and chart tools include a screenshot when one is available.
Whatever your account can do in Basedash is exactly what your agent can do through MCP — nothing more.
We’ve been building our own internal dashboards this way for the last month. Most of them never touched the Basedash UI until someone opened the link.
MCP write is available today for every Basedash workspace and every MCP client.
https://charts.basedash.com/api/public/mcp as a remote MCP server in Cursor, Claude, or your client of choice — if you’re already connected, the new tools are there nowclaude mcp add basedash --transport http https://charts.basedash.com/api/public/mcpFor client-specific install steps, see the MCP server feature page and the docs.
Not just read. Write.
Written by

Founder and CEO of Basedash
Max Musing is the founder and CEO of Basedash, an AI-native business intelligence platform designed to help teams explore analytics and build dashboards without writing SQL. His work focuses on applying large language models to structured data systems, improving query reliability, and building governed analytics workflows for production environments.
Basedash lets you build charts, dashboards, and reports in seconds using all your data.